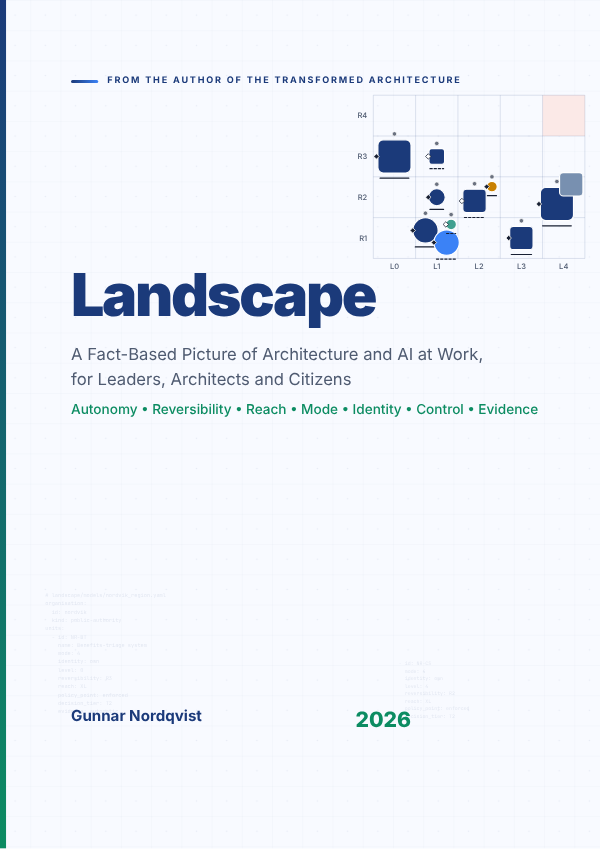
Cover of Landscape

Companion · Teacher's guide

Landscape

Lectures, teaching plans, discussion questions, exercises and the answers to every self-test, on one page to print.

4 modules20 lessons

The course

All courses / Landscape / Teacher's guide

How to use this guide

The guide holds everything a teacher needs to run the course on Landscape: the lecture of each module with a timed outline, the teaching plan of every lesson, the discussion questions, the exercises and the answers to the self-tests. The agendas of the three formats are on the course page; the slides are in the deck of the book.

Keynote on the whole book · 45 minutes

A fact-based picture of AI at work: a test, a notation and nine rules of thumb

For a mixed audience of leaders, architects, public officials, journalists and citizens, with no technical background assumed

The keynote follows the book's method: ask first, show the measured answer second, and only then talk about why the two differ. It puts questions from the test to the audience, shows that the measured picture is lower, flatter, quieter and later than the one most of us carry, and names the instincts that give wrong answers a direction. It then draws the alternative, a notation in which every AI use is one mark read the same way every time, on two fictional organisations, and ends with a stance that is neither optimist nor pessimist: the facts allow a reasonable hope and demand work.

8 minA test for the room
  • Four questions put to the audience with three options each; answers are collected before the measured ones are shown.
  • In 2025, 19.95 per cent of EU enterprises with ten or more employees used at least one AI technology; 15.36 per cent of people aged 16 to 74 had used a generative AI tool for work in the previous three months.
  • The most frequent recorded harm in the AI Incident Database is people using AI to defraud, deceive or manipulate other people.
  • Wrong answers are not ignorance, which would be random; they have a direction.
7 minWhy the old pictures mislead
  • One box labelled AI, humans versus machines, and the cloud each hide a scale.
  • Eurostat counts eight technologies, used in 2025 by between 11.75 and 1.39 per cent of enterprises.
  • Rosling's remedy for two boxes was fixed scales drawn the same way every time; the same remedy applies here.
10 minOne mark, seven dimensions
  • Autonomy level, reversibility, reach, usage mode, identity, control and evidence: column, row, size, colour, shape, diamond and seat, baseline.
  • Nordvik Region's landscape read in thirty seconds: the empty corner first, the names last.
  • The grey square at Level 4 Autonomous with no seat: AI that nobody chose, on both fictional landscapes.
  • Every figure of the two organisations is illustrative and rendered from a model; none is data.
12 minNine instincts, nine questions
  • Which ones, and how many? At which level, for which action? Used for what, and deployed by whom?
  • What bent the last curve? What is the base rate and the quiet harm? Divided by what?
  • What was decided, by whom, and what would reverse it? What do the other two chairs see? Who held the seat?
  • Each rule has a limit: a rate does not make one irreversible outcome small.
8 minA reasonable hope that demands work
  • Label every statement about the future observable, expected or speculation, and write projections so they can be shown wrong.
  • The picture is quieter than either story told about it, and the designs that govern agents exist.
  • Monday: count the units, place them on the grid, name the seats, test the promises, and render the picture again in a quarter.

What the audience takes away

  • Ask of any number about AI who produced it, over what population, and what the denominator is.
  • Ask of any AI use at which level it acts, how reversible its actions are, who holds the seat, and whether the evidence is automatic or a promise.
  • A landscape drawn the same way every time lets a board, an architect, an official and a citizen look at one page and ask the same questions.

Module 1 · Part I · The Test and the Picture

Part I gives the participant the test, the picture and the vocabulary. It opens with fourteen fact questions answered from public datasets, shows why the four familiar pictures of technology at work hide what the data show, defines the landscape of who acts, with whose identity and under whose decision, and teaches Contour, the notation that draws every AI use as one mark with seven dimensions. The participant leaves able to read a one-page landscape in a fixed order and to sketch one by hand.

Lecture · 45 minutes

A test, four old pictures and one new one

The lecture carries the argument of Part I. It starts where the book starts, with a test whose measured answers are lower, flatter, quieter and later than the picture most of us carry, and argues that the wrong answers have a direction because they come from instincts, not from ignorance. It then shows why the architecture diagram, the box labelled AI, humans versus machines and the cloud each hide what matters, defines the landscape from three scenes, and ends by reading Nordvik Region's one-page landscape aloud in Contour.

8 minThe test before the talk
  • Put three of the fourteen questions to the room and collect answers before showing the measured ones, as Chapter 1 asks.
  • Give the measured answers: 19.95 per cent of EU enterprises with ten or more employees used at least one AI technology in 2025, and the share rose by less than one percentage point between 2021 and 2023.
  • Random choice would give about 4.7 of the fourteen; systematic misreading has a direction, and the direction comes from instincts that serve us well elsewhere.
8 minFour old pictures and what each hides
  • The architecture diagram shows how a system is built, and nothing about people, identity, decision or time.
  • The box labelled AI hides eight technology types, used in 2025 by between 11.75 and 1.39 per cent of enterprises.
  • Humans versus machines puts one line where the autonomy levels put four; the cloud hides ten services, a place and a law.
  • The author's survey of 284 diagrams of the seven volumes found 275 flowcharts and no legend: care in one picture does not give comparability across pictures.
9 minThe landscape, from three scenes
  • A quarantined email at Nordvik Region: software acted at the highest autonomy, with an identity of its own, and nobody decided.
  • A caseworker's draft: AI beside people acts with a person's identity and can do nothing that person could not do.
  • An overnight claim at Hansa Mutual: an agent acts with its own identity inside a limit that code outside it enforces.
  • Evidence is what a system produces; attestation is what a person or supplier declares.
12 minContour: one mark, seven dimensions
  • Column is the autonomy level, row the reversibility tier, size the reach, colour the usage mode, shape the identity.
  • A diamond is the policy point, a grey seat carries the decision tier, a baseline is solid for automatic evidence and dashed for attested.
  • Read the benefits-triage system NR-BT aloud, then the bare square NR-AMB: every missing control is drawn as an absence.
  • The top-right cell, Level 4 Autonomous at R4 Irreversible, is the empty corner and is shaded in every view.
8 minReading in a fixed order, and the stance
  • The six reading steps: the empty corner first, then squares at Level 3 and above, missing seats, dashed baselines at R3, colours, and names last.
  • The stance is possibilist: the data support neither the loudest hopes nor the loudest fears; they support work.
  • Every statement about the future carries the label observable, expected or speculation.

What the audience takes away

  • Ask first, show the measured answer second, and only then talk about why the two differ.
  • Everything the old pictures hid lies on a scale, so a picture with fixed scales and fixed meanings can show it.
  • A landscape is read in a fixed order: the empty corner first and the names last.

Chapter 1 · 90 minutes

Introduction: A Test, a Picture and a Stance

The lesson runs the book's opening test of fourteen questions, compares the group's answers with the measured ones, and introduces the nine instincts that give wrong answers a direction. It presents the five grades of source and the caption rules the book uses for its young, thin data, the possibilist stance with its three labels for statements about the future, and a first glance at the landscapes of Nordvik Region and Hansa Mutual.

Learning objectives

  • State the measured answers to at least five of the fourteen test questions with their year and dataset.
  • Explain why the book treats wrong answers as instincts with a direction and not as ignorance.
  • Grade a quoted figure about AI at work against the book's five ranks of source.
  • Label a statement about the future as observable, expected or speculation.

Key concepts

The landscape
The world that appears inside a large European enterprise or public authority when its architecture becomes code and AI goes to work in it, as an assistant to a person, a feature a supplier switched on, or an agent with an identity of its own.
The nine instincts
The box, binary, model, straight-line, fear, size, destiny, single-perspective and blame instincts. Six names are Rosling's; the box and binary instincts are close relatives of his generalisation and gap instincts, and the model instinct has no counterpart in his list.
Five grades of source
Official statistics first, probability surveys second, self-selected surveys third, incident databases fourth and vendor reports fifth. A vendor survey or a self-selected sample is marked as such wherever the book uses one.
Possibilist stance
Rosling's word for someone who is neither optimist nor pessimist, looks at the measured picture, sees the problems and the progress in it at the same time, and asks what can be done.
Observable, expected, speculation
The three labels for statements about the future, taken from AI Governance, Chapter 22: happening now and documented; supported by a decided instrument or strong evidence with uncertain timing or form; plausible and consequential but not yet evidenced.

Teaching plan

20 minParticipants take the fourteen-question test alone, in writing. The teacher collects every letter before any measured answer is shown, as the chapter asks of a team.
20 minThe teacher walks through the measured answers with Figure 1.1, giving figure, year and dataset for each, and notes which questions are self-tests and which have comparable perception data.
15 minShort lecture on why we get them wrong: the nine instincts and the questions each one explains, then the five grades of source and the caption rules.
25 minExercise: groups build the room's own answer sheet and map its largest misses to instincts.
10 minClosing: the possibilist stance, the three labels, and a first look at Figures 1.2 and 1.3 without trying to read them fully.

Discussion

  1. On which question did the room's answers lean furthest from the measured value, and what in your daily sources of news or work would explain the direction of that lean?
  2. The chapter labels its own claim that readers score below chance as speculation. What would it take to turn that claim into something measured?
  3. Much of what is published about AI at work comes from parties with an interest in the answer. How should that change the way a figure is quoted in your organisation's own papers?

Exercise · 25 minutes

The room's answer sheet

In groups of four, tally the group's letters for all fourteen questions beside the measured answers. Pick the three questions where the group was furthest from the measured value. For each, write the measured figure with its year and source as the chapter gives it, name the instinct or instincts the chapter assigns to that question, and write one sentence on where the group's picture came from. Then look at Figure 1.2 or Figure 1.3 and write down the one question the picture asks its organisation's leader without the notation being explained.

Deliverable: A one-page sheet: the group tally, three misses each with measured figure, source, instinct and origin of the picture, and one question read from a landscape figure.

Self-test

  1. What share of EU enterprises with ten or more employees, outside the financial sector, used at least one AI technology on Eurostat's list in 2025?

    1. 19.95 per cent
    2. 30.36 per cent
    3. 55.03 per cent
    4. 8.06 per cent
  2. In the AI Incident Database snapshot of 2 November 2026, which domain is the largest among the 1,498 classified incidents?

    1. Physical injury from robots and self-driving vehicles, with 566 incidents, 412 of them on public roads
    2. AI systems pursuing their own goals against human goals, with 412 incidents
    3. Malicious actors and misuse, with 566 incidents, 412 of them fraud, scams and targeted manipulation
    4. Hardware and software failures that made services unavailable, with 566 incidents, 412 of them from ransomware
  3. Where does the book rank a self-selected survey such as the Stack Overflow Developer Survey among its five grades of source, and how does it quote it?

    1. First, as an official statistic about the population of all developers
    2. Second, as a probability survey with a sampling frame and weights
    3. Fifth, as a vendor report quoted only where nothing better exists
    4. Third, as perception data about its own respondents and nothing wider

Chapter 2 · 75 minutes

The Old Pictures: Boxes, Binaries and the Cloud

The lesson tests four familiar pictures of technology at work against measured data: the architecture diagram, the box labelled AI, humans versus machines, and the cloud. It uses the author's survey of the 284 diagrams of the seven volumes, Eurostat's eight AI technology types and ten cloud service types, and gives the five questions that test any diagram and the requirements a better picture must meet.

Learning objectives

  • Explain what each of the four old pictures was good for and what each hides.
  • Apply the five questions for testing a picture to a diagram from the participant's own organisation.
  • Compare the shares of EU enterprises using each of Eurostat's eight AI technology types in 2025.
  • List the requirements the chapter sets for a better picture.

Key concepts

The four old pictures
The architecture diagram of boxes joined by arrows, the single box labelled AI, the two camps of humans versus machines, and the cloud. Each served well in an earlier landscape and each hides most of what matters in the present one.
The diagram survey
The author's own count, in November 2026, of the 284 diagram files of the seven volumes: 275 are flowcharts, 274 use the rectangle, none carries a legend, and usage modes and autonomy levels are drawn as such in only 16 and 26 diagrams.
Eight technology types
Eurostat does not ask whether an enterprise uses AI; it asks about eight technologies one at a time. In 2025 the shares ran from 11.75 per cent for text mining to 1.39 per cent for AI that moves machines autonomously.
Five questions for a picture
Who acts? With whose identity? At which level? Who decides? How has it changed? Any diagram of technology at work can be tested with them in a minute.
Single source of truth
The chapter's requirement that pictures be rendered from one model kept as code, following Architecture as Code (Chapter 6): consistent pictures come from a single source of truth, not from consistent draughtsmen.

Teaching plan

10 minOpening: the teacher reads the three sentences of the chapter's first paragraph and asks the room to sketch, in thirty seconds each, the picture each sentence carries.
20 minLecture on the four pictures with Figures 2.1 to 2.4: the diagram survey, the eight technology types, the place of the consequential line between Level 2 and Level 3, and the ten cloud services.
25 minExercise: pairs test one real diagram with the five questions and record what it cannot answer.
10 minPairs report the question their diagram failed most clearly; the teacher collects the failures on the board under the five questions.
10 minClosing: what a better picture needs, and Figure 2.5 as the picture the boxes of the earlier volumes could not show.

Discussion

  1. The author reports that his own seven volumes use the same grey for two different things and carry no legend. What does that finding suggest about relying on careful individuals to make pictures comparable?
  2. Among large AI-using enterprises ICT security is the most common purpose, while among all AI-using enterprises it is marketing or sales. Which population is your organisation usually compared with, and why does it matter?
  3. The chapter says the bumpy cloud outline is a placeholder for a drawing nobody has made. Which facts about place and law would that drawing need to show for your organisation?

Exercise · 25 minutes

Five questions for one diagram

Bring or sketch one diagram your organisation actually uses to explain a system that involves AI; if you have none, use the description of the closing diagram of Nordvik Region in the chapter. Put the five questions to it in order: who acts, with whose identity, at which level, who decides, and how it has changed. For each question, write what the diagram shows, or write that shape and colour do not tell you. Then list which of the chapter's requirements for a better picture the diagram already meets and which it lacks.

Deliverable: A table of five rows, one per question, with what the diagram answers and what it leaves out, and a short list of met and missing requirements.

Self-test

  1. According to the author's survey of the 284 diagrams of the seven volumes, how many carry a legend?

    1. All 284, because one style guide required it
    2. None of the 284, although six colour classes are shared
    3. The 275 flowcharts, but not the nine diagrams of any other type
    4. Only the 32 that use a rounded stadium shape
  2. Why does the chapter say the picture of humans versus machines puts its one line in the wrong place?

    1. Because it draws the line between Level 3 and Level 4, where a person is still informed and can stop each action
    2. Because Eurostat measures no technology in which a machine acts alone
    3. Because it draws the line after Level 0, while the consequential line runs between Level 2 and Level 3
    4. Because the line should separate vendors from the organisation's own staff
  3. On the Commission's Digital Decade definition for cloud, which counts intermediate and sophisticated services only, what was the 2025 share of EU enterprises?

    1. 46.69 per cent, against a headline of 52.74 per cent
    2. 52.74 per cent, the same as the headline
    3. 44.91 per cent, the share of enterprises buying e-mail as a cloud service
    4. 14.86 per cent, the share buying computing power

Chapter 3 · 90 minutes

The New Landscape: Who Acts, With Whose Identity, Under Whose Decision

The lesson defines the landscape in plain words, each term from a scene: architecture kept as code, AI beside people acting with a person's identity, and AI as agents acting with an identity of their own. It introduces the six usage modes, the five autonomy levels, the policy point, evidence as against attestation, the seat and its decision tiers, and the seven questions for walking an estate, using Nordvik Region's eleven units as the worked example.

Learning objectives

  • Classify an AI use by usage mode, autonomy level and identity using the chapter's definitions.
  • Distinguish a limit enforced by a policy point outside the model from a rule in an agent's instructions.
  • Distinguish evidence from attestation with an example of each.
  • Walk one AI use through the seven questions and record the answers.

Key concepts

Architecture as Code
Keeping the description of an organisation's systems as text files in version control, where every change is dated, attributed and reviewable, tests fail when description and reality disagree, and a broken rule stops a release. A document can say anything; a test can fail.
Usage mode
The way an organisation comes to use a model, one of six adopted from AI Governance, Chapter 2: Mode 0 Ambient AI, Mode 1 Conversational assistants, Mode 2 Embedded workplace assistants, Mode 3 Agentic work tools, Mode 4 Built AI applications and Mode 5 Autonomous production agents.
Policy point
The book's name for the policy decision point: a separate component outside the agent that checks every action the agent asks to take against a written list of what it may do, and refuses anything not on the list.
Evidence and attestation
In the words of AI Governance, Chapter 11, attestation is a person asserting that a control operated; evidence is a machine-generated artefact that demonstrates it. A contract clause is attestation; a log showing the system halting is evidence.
Seat and decision tier
The seat is where the notation draws the person who holds the decision right for a unit. Its tier is T1 operator or user, T2 system owner or architect, T3 an executive, T4 the board or an elected body; T0 means nobody is named.

Teaching plan

10 minOpening: the teacher tells the scene of the quarantined email at Nordvik Region and asks the room who decided that the message should be held.
25 minLecture from the chapter's scenes: architecture as code, the caseworker's draft, the overnight claim, the six modes, the five levels, the IT-operations agent's three rules and the 26-minute stop drill.
15 minGuided reading of Figure 3.4: the rows HM-CT and HM-AMB read aloud, then participants read one further row each to a neighbour.
30 minExercise: participants walk three AI uses through the seven questions and write each one in the book's vocabulary.
10 minClosing: mode drift, the three labels, and why Nordvik Region runs a Level 4 unit by choice while Hansa Mutual has one only by default.

Discussion

  1. Both illustrative organisations carry the same grey square: Mode 0, Level 4 Autonomous, no policy point, no seat, no proof. Why is it identical in two organisations that differ in almost everything else?
  2. The chapter says a name is necessary and not sufficient. What else would a named person need before the seat above a mark means that someone can actually decide?
  3. Nordvik Region's citizen-service assistant sits at Level 4 Autonomous by choice. What about its actions makes that position defensible, and what change to the unit would make it indefensible?

Exercise · 30 minutes

Walking an estate with seven questions

Choose three AI uses in your own organisation, at least one of which came with a product without anyone choosing it. If you cannot name three, use the benefits-triage system, the rostering pilot and the ambient AI of Nordvik Region from the chapter's table. Ask the seven questions of each use, not of each product: what it may do without approval of each action, what undoing would take, how many people it touches in a year, how the organisation came to use it, whose identity it acts with, what enforces its limits and who holds the decision right, and where the proof comes from. Where an answer is not known, write that it is not known.

Deliverable: A table of three rows in the form of the chapter's table of Nordvik Region's units, each row stating mode, identity, level, reversibility, reach, policy point, seat and proof, with unknowns marked.

Self-test

  1. In the chapter's scene, what makes the third rule of Hansa Mutual's IT-operations agent, that it may never delete data, a limit and not a hope?

    1. The rule is written in clear words at the top of the agent's instructions and repeated in its playbook
    2. The supplier has confirmed the rule in a signed contract clause
    3. The agent has been evaluated and found never to have asked to delete data
    4. A separate component outside the agent checks every requested action and refuses the rest
  2. Nordvik Region's internal staff assistant drafts a letter that a caseworker edits and sends under their own name. Which property defines this as AI beside people?

    1. It is built on a large language model
    2. It acts with the caseworker's login and permissions, so it can do nothing the caseworker could not do
    3. It serves about 3,200 staff, which places its reach in class L and makes it one of the Region's larger marks
    4. It is hosted by a European cloud provider, in the EEA only, with keys that the Region itself holds
  3. In the scenario, Nordvik Region's first out-of-hours stop drill of the benefits-triage system takes 26 minutes against a budget of 15. What does the chapter conclude about the contract clause that required the stop?

    1. The clause was not false; it was a promise, which is attestation and not evidence
    2. The clause was false and the supplier was in breach of the tender
    3. The clause was evidence, because the supplier had accepted it in writing
    4. The clause was unnecessary, because caseworkers decide every case

Chapter 4 · 90 minutes

The Notation: One Picture, Drawn the Same Way Every Time

The lesson teaches Contour. Participants learn to read one mark aloud through its seven dimensions, to use the three frames and the six views V1 to V6, to say what the notation deliberately leaves out, and to read any landscape in six fixed steps. They finish with pen and paper, drawing marks by hand as the chapter describes, with Nordvik Region's and Hansa Mutual's landscapes of 1 January 2027 as the reference.

Learning objectives

  • Read a single mark aloud, naming all seven dimensions and the question each answers.
  • Explain the empty corner and the red outline rule for a Level 3 Bounded mark without a filled diamond.
  • Select the view, V1 to V6, that answers a given question about a landscape.
  • Draw a set of units by hand as marks on the autonomy by reversibility grid.

Key concepts

Unit and mark
A unit is one AI use: one way in which an organisation puts a model to work, with the people who work with it. The same model used in two ways is two units. Contour draws each unit as one mark.
The seven dimensions
Autonomy level as the column, reversibility tier as the row, reach as the size, usage mode as the colour, identity as the shape, control as a diamond and a seat, and evidence as a baseline. Every mark carries these and nothing else.
The empty corner
The top-right cell, Level 4 Autonomous at R4 Irreversible, shaded in every view. Its emptiness is a rule of the drawing, not a finding: a landscape that put a mark there would be flagged, not hidden.
Delegated access without delegation
The book's own term for a circle at Level 3 Bounded or above: a person's account being used without that person approving each action. A square there is an agent.
Frames and views
Three frames, boundary, time and comparison, arrange the marks and add no dimension. Six views are each defined once: V1 one-page landscape, V2 over time, V3 supply and sovereignty, V4 decision rights, V5 evidence, V6 comparison.

Teaching plan

15 minThe teacher reads NR-BT aloud from Figure 4.1, dimension by dimension, then NR-TL and NR-AMB, showing how each missing control is drawn as an absence.
20 minLecture on the scales: the rule for units with several actions, the reach classes counted in people, the frames, and what each of the views V3 to V6 shows that V1 cannot.
15 minParticipants apply the six reading steps to Figure 4.2, Hansa Mutual, in silence, write their observations, and compare them with a neighbour before reading any name.
30 minExercise: pen and paper. Participants draw a V1 by hand from a written list of units.
10 minClosing: what the notation leaves out and why, and the model excerpt for NR-BT as landscape as code.

Discussion

  1. The notation draws no judgement of value and cannot say which of two organisations is better governed. What is gained and what is lost by that restraint?
  2. Hansa Mutual's IT-operations agent sits at Level 3 and R3 although no single action of it is both. Is the rule that produces this mark cautious in the right way, and what would the opposite rule hide?
  3. People appear in the notation only as the seat. What does that choice say about the question the book asks of people, and what would an organisation chart add or confuse?

Exercise · 30 minutes

Pen and paper: a first V1

On a blank sheet, draw the grid of five columns and four rows and shade the top-right cell. Using the table of Nordvik Region's eleven units from Chapter 3, draw at least six of them as marks: a circle or a rounded square in the right cell, at one of four sizes, with the mode's number inside, a diamond on the left edge where a policy point exists (filled or hollow), a small circle above with the decision tier where someone is named, and a solid or dashed line beneath. Then swap sheets with a neighbour and apply the six reading steps to their drawing without reading the names.

Deliverable: A hand-drawn V1 of at least six units with a legend, and the neighbour's written observations from the six reading steps.

Self-test

  1. A unit performs several kinds of action. According to the chapter, at which column is its mark drawn?

    1. At the level of the action it performs most often in a year
    2. At the average of the levels of all its actions, rounded down
    3. At the highest level it holds for any action that changes something outside the unit
    4. At the highest level it holds for any action at all, read-only actions such as enriching an alert included
  2. How does Contour draw a Level 3 Bounded mark that has no filled diamond, and why?

    1. Hollow with a cross through it, because a unit without a policy point counts as retired until one is enforced
    2. With a thin red outline, because such a mark is Level 4 with a misleading label
    3. With a dashed baseline, because its evidence is only attested
    4. In the empty corner, because it cannot be reversed
  3. Reach is drawn as one of four sizes. What does the class XL count?

    1. 10,000 or more transactions handled by the unit in a month
    2. More than half of the organisation's employees
    3. 10,000 or more euros of cost per year
    4. 10,000 or more people whose work or outcomes the unit's actions touch in a year

Module 2 · Part II · The Instincts

Part II takes the nine instincts one at a time: box, binary, model, straight-line, fear, size, destiny, single-perspective and blame. Each lesson follows the chapter's form: the test questions the instinct explains, a fair hearing for the instinct, the evidence with its limits, the picture corrected with a view in Contour, and one rule of thumb with the place where it stops applying. The participant leaves with nine rules and has applied each to a landscape or a document of their own.

Lecture · 60 minutes

Nine instincts, nine rules of thumb

The lecture carries the argument of Part II: each instinct is a habit that serves well almost everywhere else and misleads on this landscape for a reason that can be shown in public data. It groups the nine by what they distort. The box, binary and model instincts hide what a unit is; the straight-line, fear and size instincts distort numbers and stories; the destiny, single-perspective and blame instincts hide decisions. For each group it shows one piece of evidence, one corrected view of Nordvik Region or Hansa Mutual, and the rules of thumb with their limits.

6 minThe form of every chapter
  • Each chapter gives the instinct a fair hearing first: a budget needs a line, the law draws binaries on purpose, fear is useful where the hazard is real.
  • Each states what its evidence does and does not show, and separates published figures from the author's own estimates and classifications.
  • Each corrects the picture with one view and ends in one rule with a stated limit.
16 minWhat a unit is: box, binary, model
  • Box: Eurostat counts eight technologies and seven purposes; Nordvik Region's committee paper shows one rectangle where the register lists thirteen entries. Ask which ones, and count them before you judge them.
  • Binary: automated is five answers, not one. Hansa Mutual's SOC investigation agent holds three levels across four actions, and the line that matters runs between Level 2 Supervised and Level 3 Bounded.
  • Model: the incident record has no model column, and Annex III of the AI Act lists uses. Ask what it is used for and who deploys it before asking which model it is.
  • In the supply and sovereignty view the model is a chip at the edge; the one-page landscape names no model at all.
16 minNumbers and stories: straight line, fear, size
  • Straight line: four baseline trajectories for the same series ended at 20.29, 16.76, 35.92 and 54.28 per cent in 2030. Ask what bent the last curve and what could bend this one.
  • Fear: outages by failure, 17.97 per cent of enterprises, outnumber outages by attack, 3.43 per cent. Find the base rate and the quiet harm the story hides.
  • Size: 10.45 million ICT specialists are 5.0 per cent of employment. Never accept a number alone; ask what it is divided by and compared with.
  • The limits matter: the base rate does not help with a mark in the empty corner, and a rate does not make one irreversible outcome small.
16 minDecisions: destiny, single perspective, blame
  • Destiny: a date in the AI Act moved by sixteen months through a recorded decision. Ask what was decided, by whom, and what it would take to reverse it.
  • Single perspective: productivity reads colour and size, security shape and diamond, compliance row, seat and baseline. Read from the other two chairs before you decide.
  • Blame: the second draft of the post-mortem finds that nobody was named to decide the time to stop. Look for the seat before the culprit.
  • In the scenario both organisations start 2027 with one row at T0 and end it with none.
6 minWhat the nine have in common
  • Each rule turns a statement into a question that a landscape, a register or a record can answer.
  • The evidence is about institutions and records; where no survey measures what people or boards perceive, the chapters say so.
  • Naming the instincts is half the method; the other half is a picture that resists them.

What the audience takes away

  • An instinct is a useful habit applied in the wrong place; each rule of thumb names where it stops applying.
  • Every corrected picture is the same landscape read for a different dimension: count, column, chip, trail, seat, size, row and baseline.
  • The marks that most often need a decision are the quiet ones: no seat, no diamond, a dashed baseline at R3 Hard to reverse.

Chapter 5 · 75 minutes

The Box Instinct: AI Is Not One Thing

The lesson treats the box instinct: drawing AI as one box and the cloud as one cloud. It works through Questions 4, 5 and 10 with Eurostat's counts of technologies, purposes and cloud services per enterprise, then corrects the picture with Nordvik Region's one-page landscape and its supply and sovereignty view. The rule of thumb is to ask which ones, and to count them before judging them.

Learning objectives

  • Explain why one risk rating, one owner and one decision cannot be applied to a box labelled AI.
  • Report Eurostat's 2025 figures on technologies and purposes per enterprise, separating published shares from the author's estimates.
  • Count the units of an organisation by usage mode, including the Mode 0 line nobody procured.
  • Rewrite a singular question about the AI or the cloud as plural questions a landscape can answer.

Key concepts

The box instinct
The habit of drawing AI as one box, and the cloud as one cloud, when the measured landscape is many uses of many kinds at many levels. The other eight instincts stand on it.
Aggregate, not a question
Uses at least one AI technology is derived from answers about eight technologies asked one at a time; nobody was asked it. The 2025 aggregate rests on eight technologies where earlier years had seven.
The cloud as a stack
Eurostat groups ten cloud services into basic, intermediate and sophisticated. In 2025, 5.56 per cent of enterprises bought only basic services, 5.69 per cent at most intermediate ones and 40.89 per cent at least one sophisticated service.
A unit is a use
The notation draws one way of putting a model to work, not a system, a vendor or a product. When one product drafts for a person and also acts on its own, it is written as two lines.
Rule of thumb: which ones
When someone says the AI or the cloud, ask which ones, and count them before you judge them. The rule stops applying once the units are known; aggregation is not wrong if you can open the aggregate.

Teaching plan

10 minOpening: the teacher presents the four-page committee paper headed The AI system and asks the room whether the committee can answer its question as put.
20 minLecture on the evidence with Figures 5.1 to 5.3: technologies per enterprise, the seven purposes and how large enterprises reorder them, and the three layers of the cloud stack.
10 minGuided reading of Figures 5.4 and 5.5: participants count colours, shapes and seats in Nordvik Region's V1, then count containers in its V3.
25 minExercise: participants turn a box into a count and draft the first lines of a landscape model.
10 minClosing: the rule of thumb, its two halves and where it stops applying; each participant states the unit in their count that they would look at first.

Discussion

  1. ICT security is the most common purpose among large AI-using enterprises and the wrong answer for the EU average. Where in your own work do you take the kind of AI you know for the whole?
  2. The chapter says a landscape without the Mode 0 line shows what was decided rather than what runs. Who in your organisation would be able to write that line today?
  3. A committee needs each item to be one thing it can approve, pause or reject. How can a paper respect that need without drawing the box?

Exercise · 25 minutes

From the box to the count

Take a recent paper, slide or strategy sentence from your own organisation that says the AI or the cloud in the singular; if you have none, use Nordvik Region's committee paper from the chapter. Write one line per unit in the form of the chapter's condensed model fragment: an identifier, a name, the usage mode and a status. Split any product that both drafts for a person and acts on its own into two lines, and write the Mode 0 line even though nobody procured it. Then apply the executive's three questions to your count: which unit has no named decision-holder, which touch 10,000 or more people a year, and which act at Level 4 Autonomous.

Deliverable: A list of units with identifier, name, usage mode and status, with the Mode 0 line included, and written answers to the three questions.

Self-test

  1. The chapter says about four in ten AI-using EU enterprises used three or more AI technologies in 2025. What is the status of that figure?

    1. A share Eurostat publishes directly in its table on AI by size class
    2. A result from a vendor survey of AI-using enterprises
    3. The author's estimate, from dividing Eurostat's 8.28 per cent by its 19.95 per cent
    4. A figure for large enterprises only, those with 250 or more persons employed, taken from Eurostat's table
  2. In Nordvik Region's one-page landscape of 1 January 2027, how many units are drawn and how many does the model hold?

    1. Eleven are drawn; the model holds thirteen, two of them planned for later in the year
    2. Thirteen are drawn; the model holds seventeen, four of them retired
    3. Seven are drawn; the model holds eleven, four of them paused
    4. Eleven are drawn and the model holds eleven, all of them active
  3. Why does pausing the AI system, as the committee paper proposes, not work as a single decision at Nordvik Region?

    1. Because the AI Act, as amended in 2026, forbids a public authority from pausing a high-risk AI system once it is in use
    2. Because it would pause some units, could not pause others, and would make no difference to features the vendors run
    3. Because the committee has no authority over systems bought from suppliers
    4. Because all thirteen entries are hosted outside the EU and cannot be reached

Chapter 6 · 90 minutes

The Binary Instinct: Neither Automated Nor Manual

The lesson treats the binary instinct: seeing automated or manual where the landscape has five autonomy levels. It works through Questions 6, 13 and 14 with data on generative AI use, developers' trust and management by software, then reads Hansa Mutual's landscape column by column and its decision-rights view action by action. The rule of thumb is to ask at which level, for which action.

Learning objectives

  • Explain why the autonomy level belongs to an action in a context and not to a product.
  • Interpret the survey figures on use, trust and automated management, stating what each survey did not ask.
  • Draft a table of action classes and levels for one AI use, in the form of a decision-rights view row.
  • Identify where a legal binary, such as Article 22 of the GDPR, remains the question.

Key concepts

The binary instinct
The habit of seeing two states where the data show a scale: automated or manual, human or machine, in the loop or out of it. It is a cousin of the habit Rosling named the gap instinct, applied to work.
Level per action class
The same system can hold Level 1 for one action and Level 3 for another. AI Red Team sets the level per action from its reversibility, blast radius, confidence in the system, exposure to attacker-controlled input and the decision tier.
The line between Level 2 and Level 3
The line that matters is between Level 2 Supervised and Level 3 Bounded, because above it a class of actions happens without a person approving each one. It is the difference between approving each action and having approved a playbook.
A gradient of automated management
In the AIM-WORK survey, 24 per cent of EU workers reported rosters and 21 per cent tasks allocated automatically, while 5 per cent had the speed of their work set automatically. The forms that arrange work are reported far more often than those that press on a person directly.
Rule of thumb: which level, which action
Ask at which level, for which action: automated is five answers, not one. Apply it whenever a sentence contains automated, autonomous, manual or human in the loop.

Teaching plan

10 minOpening: the tender line Is the system automated? The teacher asks three participants to answer as the union representative, the head of home care and the data protection officer.
25 minLecture on the evidence with Figures 6.1 to 6.3: use and trust among developers, the eight forms of automated management, and the illustrative counts of units per level. The teacher states at each step what the survey did not ask.
15 minGuided reading of Figure 6.5: the four actions and three levels of the SOC investigation agent HM-SOC, and where the vertical between the third and fourth columns falls.
30 minExercise: participants write the levels per action class for a rostering system or a system of their own.
10 minClosing: where the rule stops applying, and why a higher level is not worse as such but defensible or not in relation to reversibility.

Discussion

  1. Close to half of the developers who answered used AI tools daily while about 3 per cent highly trusted the output. The author reads this as Level 1 Assisted seen from the inside and calls it an interpretation. What other readings fit the same two panels?
  2. Neither survey of automated management asked who could override an allocation. What would you need to ask the workers or the employer to place task allocation at a level?
  3. A system described as having a human in the loop may be Level 2 with approvals given in seconds. Which measurements would show your organisation that approval had become a reflex?

Exercise · 30 minutes

From a tick to a table

Work in threes on Nordvik Region's rostering system NR-SW as it stands at the start of 2027, or on an AI use of your own. List its action classes; for NR-SW these are drafting a roster, offering an open shift and flagging a breach of the rest rules. For each class write the autonomy level it holds, who can change that level, and whether a policy point enforces it or a document merely describes it. Mark the unit's ceiling and name the tier in the seat. Then draw the row by hand as the decision-rights view would: a bar to the ceiling, thin bars per action class, a filled or hollow diamond and the seat.

Deliverable: A table of action classes with level, decision-holder and enforcement, and a hand-drawn V4 row for the unit with ceiling, thin bars, diamond and seat.

Self-test

  1. In Hansa Mutual's decision-rights view, at which level does the SOC investigation agent HM-SOC hold the action of wiping a host, and why?

    1. Level 3 Bounded, because the playbook lists it as a pre-approved action
    2. Level 4 Autonomous, because it changes nothing outside the case record
    3. Level 2 Supervised, because an analyst approves each wipe before it runs
    4. Level 0 Advisory, because a wiped host is hard to reverse, so the agent proposes and a person does it
  2. Which two forms of automated management did EU workers report most often in the AIM-WORK survey?

    1. Automated instructions and the speed of work set automatically
    2. Rosters or shift hours allocated automatically, and work tasks allocated automatically
    3. Ranking on a leaderboard and points or prizes for performance
    4. Shifts that could be cancelled on a low rating, and work allocated on the basis of customer ratings
  3. What does the chapter say the EU27 rows of the Stack Overflow survey figure are?

    1. A filter on a self-selected, unweighted sample, not a representative European figure
    2. A probability sample of developers in the 27 member states
    3. An official statistic that Eurostat computes from the survey
    4. A weighted estimate for all ICT specialists employed in the EU, computed from the survey's country shares

Chapter 7 · 90 minutes

The Model Instinct: The Use Sets the Risk and the Value

The lesson treats the model instinct: asking which model first and expecting the answer to say how risky and how valuable an AI use is. It uses the AI Incident Database, the OECD's monitor and the structure of the AI Act to show that records and law follow uses and deployers, and reads Hansa Mutual's one-page and supply views, where the model is a chip at the edge. The rule of thumb puts use and deployer before model.

Learning objectives

  • Explain the chapter's comparative claim: the model bounds what a use can do, while the use and usage mode set the risk and value.
  • Describe what the AI Incident Database and the OECD monitor record, and three limits of the database's counts.
  • Relate the roles of provider and deployer and the list in Annex III of the AI Act to use, as the chapter reads them.
  • Draw two units that share a model provider in the supply and sovereignty view.

Key concepts

The model instinct
The habit of treating the model as the thing that carries the risk and the value: asking which model first and expecting the answer to say how dangerous, how useful and how well governed an AI use is.
The model bounds, the use decides
Models differ in training, openness of weights, where they are served and what they can do, so the model bounds what a use can do. The use and its usage mode decide what it does do, to whom and with what consequences.
Alleged deployer and developer
The fields the AI Incident Database carries instead of a model column, attributed by volunteer editors from press reports. The most-named deployers are scammers in 240 incidents, deepfake creators in 129 and synthetic media creators in 106.
Annex III as a list of uses
Under Article 6(2) of the AI Act the systems listed in Annex III are high-risk, and the annex lists uses, such as recruitment and the evaluation of eligibility for essential public benefits, not models. Article 6(3) narrows the class again by use.
The model chip
In the supply and sovereignty view the model appears as a small chip in its provider's container, joined by a thin line to each unit that depends on it. The model's name stays in the AI system register as text.

Teaching plan

10 minOpening: the teacher describes the incident table with no model column and asks the room to guess the three most-named deployers before showing them.
25 minLecture on the evidence: the classification of 1,498 incidents, the three limits of the record, the OECD monitor's 2025 harm types, and how Articles 3(3), 3(4), 6(2), 6(3), 25(1)(c) and 26 of the AI Act follow use: a reading of structure, not advice.
15 minGuided reading of Figures 7.3 and 7.4: participants try to find the model in Hansa Mutual's V1, then find the chip and the two thin lines from HM-CA and HM-AWT in its V3.
30 minExercise: participants rewrite a model-first statement as use and deployer, and draw the units that share a model.
10 minClosing: the two cases where the rule stops applying, and the question whether the rows of the organisation's own register are models or uses.

Discussion

  1. The chapter grants the instinct a kernel of truth: some differences between models matter. For one use in your organisation, which property of the model bounds what the use can do?
  2. Counts by year in the incident database reflect media attention and editorial throughput as much as the frequency of harm. What can such a record still tell a reader, and what can it not?
  3. At Hansa Mutual a change of mode in one unit may be read as no change because the model is the same. How would a register of models and a register of uses each show that change?

Exercise · 30 minutes

One model, two marks

Find one sentence from a proposal, an incident report or a news story in which a model is the subject: a model was deployed, made a mistake or is safe. Rewrite it with the chapter's two questions in order. What is it used for: which mode, at which level, touching whom, with what reversibility. Who deploys it: under whose authority, with whose identity, behind which policy point, with whom in the seat. Then take two AI uses in your organisation that share a model provider, or Hansa Mutual's HM-CA and HM-AWT, and sketch them by hand in the supply and sovereignty view: both marks inside the organisation's solid boundary, one chip labelled model in the provider's dashed container, a thin line from each mark, and no model name.

Deliverable: The rewritten statement answering both questions, and a hand-drawn V3 fragment with two marks, one model chip, the provider's container labelled by role and jurisdiction, and two lines.

Self-test

  1. Under Article 25(1)(c) of the AI Act, as the chapter reads it, what follows when a deployer modifies the intended purpose of a system not classified as high-risk so that it becomes a high-risk AI system?

    1. The original provider keeps every obligation for the new purpose
    2. The system falls outside the Act until the next version of the model is released
    3. The deployer is then considered to be the provider of that high-risk system
    4. The general-purpose AI model inside it becomes a model with systemic risk
  2. In Figure 7.4, why does the mark of the conversational assistants HM-CONV sit inside a model provider's dashed container, while HM-CA and HM-AWT stay inside Hansa Mutual's own boundary?

    1. Because that provider operates the HM-CONV service, while the group operates HM-CA and HM-AWT itself
    2. Because HM-CONV uses a larger model than the other two units
    3. Because HM-CONV is a high-risk AI system under Annex III, and the notation places such systems with their provider
    4. Because HM-CONV has no seat and the other two have one
  3. The Stanford AI Index 2025 reported 233 incidents for 2024, and the snapshot of 2 November 2026 holds 313 for the same year. What limit of the AI Incident Database does this illustrate?

    1. The database counts each incident once per harmed party
    2. The database only records incidents that its editors can locate in the United States
    3. The database merges incidents and hazards into one count
    4. The record is revised retroactively, as reports for earlier years arrive

Chapter 8 · 75 minutes

The Straight-Line Instinct: Curves That Bend

The lesson treats the straight-line instinct: extending the last two points of an adoption or capability curve. It uses the Digital Decade target, the four baseline trajectories the Commission computed from 2023 to 2026, the size-class and country series, the cloud decade and saturating benchmarks, then corrects the picture with V2, the landscape over time, for Nordvik Region's scenario year. The rule of thumb asks what bent the last curve.

Learning objectives

  • Explain why adoption and capability curves bend, in the chapter's terms of sums of separate decisions.
  • Compare the four baseline trajectories for AI and state what each projected for 2030.
  • Read a V2 view: trails, the new tick and the retired mark.
  • Review a projection by asking who computed it, from which points, and when it was last recomputed.

Key concepts

The straight-line instinct
The habit of taking the last two points of an adoption or capability curve, laying a ruler along them and reading the future off the ruler. It is a cousin of the instinct Rosling named for the world's population curve.
Baseline trajectory and vintage
The line the Commission's dashboard draws forward from observed points each year. For AI, the 2023, 2024, 2025 and 2026 vintages reached 20.29, 16.76, 35.92 and 54.28 per cent in 2030. They are projections, not observations.
Sums of decisions
Adoption and capability are not motion. They are the sum of many separate decisions by different organisations for different reasons, and the sum bends whenever the reasons change. None of those events is visible in the two points before it.
The trail
How the time frame draws change: a hollow outline of the mark at its earlier position, a thin line, and the filled mark at its later position, with a tick for a unit that appeared and a hollow mark with a cross for one retired.
Rule of thumb: what bent the curve
Never extend the last two points; ask what bent the last curve and what could bend this one. The rule stops applying where the thing measured is motion with a known mechanism, such as the age of a workforce.

Teaching plan

10 minOpening: the teacher shows only the four observed points and the 75 per cent target and asks each participant to mark where the share will be in 2030, then reveals the four baselines of Figure 8.1.
20 minLecture on the evidence: the same bend in every size class, Denmark's series, the cloud decade with Finland's plateau, the cloud and AI projections moving in opposite directions, and the three caveats on the compute line.
10 minGuided reading of Figure 8.4: the two trails, the retired pilot, the two new units, and what Nordvik Region's year does not do.
25 minExercise: participants test a projection with three questions and redraw a year of change as a V2.
10 minClosing: the two halves of the rule, the candidates the chapter names for the bend in the EU AI series, and Hansa Mutual's V2 with no trail at all.

Discussion

  1. The bend came in every size class in the same survey year. What does the chapter infer from that, and which of its candidate causes could you check for your own sector?
  2. The instinct pulls in both directions: the slow line made the target look unreachable and the fast line makes it look within reach. Which direction is currently shaping decisions in your organisation?
  3. Hansa Mutual's V2 for the scenario year has no trail, yet the executive board took the decision right over every agent with write access to production. What does that say about what a count of units can show?

Exercise · 25 minutes

Three questions and a trail

Part one: take a projection that has reached your organisation, or the 2026 baseline trajectory for AI from the chapter, and write down who computed it, from which points, and when it was last recomputed. Note what bent the series before and what could bend it next. Part two: list the AI uses in your organisation, or Nordvik Region's from the chapter, that changed between two dates a year apart. Draw the changes by hand as a V2: a hollow outline, a thin line and a filled mark for each unit that changed cell, a new tick for each unit that appeared, a hollow mark with a cross for each retired, and the two dates underneath. Beside each change write the decision that caused it and who signed it.

Deliverable: A three-line review of one projection, and a hand-drawn V2 with two dates and every change annotated with its decision and decision-holder.

Self-test

  1. Why did the Commission's 2024 baseline trajectory for AI reach a lower value in 2030 (16.76 per cent) than the 2023 one (20.29 per cent)?

    1. Because the 75 per cent target for 2030 had been lowered in the Commission's review of the Decision
    2. Because the second observation, for 2023, had barely moved from the first, for 2021
    3. Because Eurostat removed one technology from its list in 2023
    4. Because the share of enterprises using AI fell between 2021 and 2023
  2. In Nordvik Region's scenario year 2027, drawn in V2, which change does not occur?

    1. The rostering system NR-SW moves from Level 2 Supervised to Level 3 Bounded
    2. The agentic work tools NR-AWT move from Level 2 Supervised to Level 1 Assisted
    3. The recruitment screening pilot NR-TL is retired
    4. A unit changes row and becomes harder to reverse
  3. Denmark's share of enterprises using AI was 23.89 per cent in 2021, 15.17 in 2023, 27.58 in 2024 and 42.03 in 2025. What does the chapter use the series to show?

    1. That a line through the first two points fell while a line through the last two rises faster than anywhere in the Union
    2. That Denmark reached the 75 per cent target ahead of the other member states
    3. That the Danish survey was not run in 2024 and 2025
    4. That small countries always adopt faster than large ones

Chapter 9 · 90 minutes

The Fear Instinct: The Loud Harms and the Quiet Ones

The lesson treats the fear instinct: letting the frightening story set the agenda. It sets what respondents said concerned them, in Special Eurobarometer 554 and Pew's surveys, beside the records of Eurostat, ENISA and the AI Incident Database, and uses the evidence ladder of AI Threat to place each claim. Hansa Mutual's landscape, read in full, shows that the marks needing a decision are quiet ones. The rule of thumb asks for the base rate and the quiet harm.

Learning objectives

  • State the chapter's claim precisely: it concerns which harm is discussed first, not whether respondents fear the wrong things.
  • Compare failures with attacks as causes of ICT security incidents in Eurostat's 2024 survey.
  • Place a claim about AI harm on the five rungs of the evidence ladder.
  • Read a one-page landscape in full to find the quiet marks: missing seats and dashed baselines at R3.

Key concepts

The fear instinct
Rosling's name for the attention we give to what frightens us, out of proportion to its frequency. Here it lets stories with a frightening shape set the agenda for a board, a council or a newsroom.
Base rate
The frequency that turns a story into a share. In Eurostat's 2024 survey, 3.43 per cent of EU enterprises had services made unavailable by an attack from outside, beside 17.97 per cent by hardware or software failure.
Quiet harm
A harm with a higher base rate and a less frightening shape: a service failure, fraud, discrimination, a disclosure by mistake, a benefit deprioritised by a ranking nobody can explain. The rule asks which of these a story displaced.
The evidence ladder
From AI Threat, Chapter 4: five rungs, fiction, argument, laboratory demonstration, incident in the wild and pattern at scale. A claim is graded at the highest rung its evidence reaches.
Rule of thumb: base rate and quiet harm
When a story frightens you, find the base rate and the quiet harm it hides. The rule is for the agenda, not the register, and stops applying when the hazard is real, immediate and in your own landscape.

Teaching plan

10 minOpening: the teacher reads the Eurobarometer answers of the first paragraph and asks what kind of harm each statement concerns, then tells the story of the missing decimal comma.
25 minLecture on the evidence with Figures 9.1 to 9.3: what respondents answered, failures against attacks, ENISA's 4,875 incidents, the subdomain counts of the incident database and the evidence ladder. The two panels of Figure 9.3 are set side by side, not compared.
15 minGuided reading of Figure 9.4 in the full reading order: the agents at Level 3 Bounded first, then HM-AMB without a seat and the dashed baseline under HM-TL at R3.
30 minExercise: participants prepare a two-column briefing for a board or an elected body on one frightening story.
10 minClosing: where the rule stops applying, and Hansa Mutual's stop drill of 17 minutes against a budget of 5 as the instinct working as it should.

Discussion

  1. The chapter says the surveys do not show respondents fearing the wrong things, and that no survey cited measures what boards discuss. Why does the author take such care to limit the claim?
  2. At Nordvik Region the council asked the rogue-agent question, and the landscape showed a grey square the motion did not ask about. Which question has your own governing body asked, and which mark did it not ask about?
  3. The rule stops applying to harms that have no base rate yet. How should an organisation keep such a scenario in view without letting it take the decisions the quiet harms need?

Exercise · 30 minutes

Two columns for the agenda

Choose a frightening AI or cyber story that has recently reached your organisation, or take the motion to Nordvik Region's council asking whether the Region should pause its use of AI. Write a one-page briefing with two columns. In the first, give the base rate of that harm from the records the chapter cites, with source and period, and the rung of the evidence ladder the claim reaches. In the second, list the quiet harms the story may have displaced: outages by failure, fraud, complaints about automated decisions, data disclosed by mistake. Then read your own landscape, or Hansa Mutual's in Figure 9.4, in the full reading order and name the Mode 0 marks without a seat and the dashed baselines at R3 Hard to reverse.

Deliverable: A one-page, two-column briefing with base rate, ladder rung and displaced quiet harms, ending with the named quiet marks and one decision proposed for each.

Self-test

  1. In Eurostat's 2024 survey, for which consequence of an ICT security incident does the malicious cause edge ahead of failure or mistake?

    1. Services made unavailable
    2. Disclosure of confidential data
    3. Data destroyed or corrupted by any cause
    4. None of the three consequences
  2. On the evidence ladder, as the chapter applies it, where do agents acting beyond their mandate stand today?

    1. Pattern at scale, alongside fraud and discrimination by means of AI
    2. Fiction only, with no evidence above that rung
    3. Incident in the wild, the fourth of the five rungs
    4. Argument and laboratory demonstration, like a system escaping control altogether
  3. Read in the full order, which two marks on Hansa Mutual's landscape of 1 January 2027 does the chapter say need a decision?

    1. The Mode 0 square HM-AMB at Level 4 without a seat, and HM-TL with a dashed baseline at R3
    2. The IT-operations agent HM-ITO at R3 Hard to reverse, and the claims-triage agent HM-CT at R2
    3. The agent-boss pilot HM-AB at Level 2, and the evidence-collection agent HM-EVC at R1
    4. The two marks that sit in the empty corner at Level 4 and R4

Chapter 10 · 75 minutes

The Size Instinct: Numbers Without Denominators

The lesson treats the size instinct: being impressed by a large number without its denominator. It works through Questions 1, 2 and 8, shows ICT specialists as a count and as a share, one fact about AI in enterprises against three denominators, and an incident count that cannot be divided because no dataset counts deployments. In the notation, size has one job: reach, counted in people. The rule of thumb is never to accept a number alone.

Learning objectives

  • Explain the three reasons the size instinct misleads in this landscape.
  • Restate a lone count with its denominator, its comparison and its definition, or say that none exists.
  • Distinguish one fact measured against several denominators from two different facts.
  • Assign a reach class to a unit by counting people and write down who was counted.

Key concepts

The size instinct
The habit of being impressed by a large number on its own, without the denominator, the base rate or the comparison that would tell us whether it is large. Rosling's cure is to divide.
Count and share
ICT specialists in the EU27 rose from 5,681.3 thousand in 2011 to 10,450.8 thousand in 2025, and from 3.0 to 5.0 per cent of total employment. Both are true; the habit is to look for each beside the other.
Three denominators to ask for
People: how many people's work or outcomes does this touch? Deployments: out of how many comparable systems, users or decisions did this happen? Time: over what period, and against what period before it?
Reach class
The area of a mark encodes the people the unit's actions touch in a year, in four fixed sizes: S under 100, M 100 to 999, L 1,000 to 9,999, XL 10,000 and more. It is never a count of transactions.
Rule of thumb: never a number alone
Never accept a number alone; ask what it is divided by and compared with. A denominator corrects the size of a thing and does not excuse a harm: divide to see the size, not to see whether it matters.

Teaching plan

10 minOpening: the teacher shows the four numbers of the briefing's first page, asks what feeling they produce, then reads each again with the piece the briefing left off.
20 minLecture on the evidence with Figures 10.1 and 10.2: count and share of ICT specialists against the 20 million target, three denominators for one fact, two different facts about individuals, and why the incident count cannot be turned into a rate.
10 minGuided reading of Figure 10.3 for size alone: the six XL marks of Hansa Mutual, three that nobody built and three that the group built or bought.
25 minExercise: participants repair lone numbers and assign reach classes by people.
10 minClosing: the top row of the landscape, where the rule stops applying, and the municipal story of the denial-of-service alarm that counted guardians.

Discussion

  1. A journalist may write that most companies now use AI, which is true of large enterprises and false of the population. Which denominator do the numbers about AI in your own organisation's papers usually carry, if any?
  2. The author declines to compute a rate of harm per deployment because no public dataset counts deployments. What is gained by naming the gap instead of estimating across it?
  3. Hansa Mutual's claims-triage agent is the same size as the embedded workplace assistants. What would your board be shown about each today, and what would drawing both by people touched change?

Exercise · 25 minutes

Out of how many?

Part one: take three numbers about AI or security from a recent slide or report in your organisation, or the four numbers of the chapter's opening. For each, write what it is divided by, what it is compared with, and under which definition and period it was produced; where no denominator exists, write that it is a numerator and that any rate built on it would be speculation. Part two: for three AI uses in your organisation, or for Hansa Mutual's six XL units, write who is counted for reach in a year, as people and not transactions, assign the class S, M, L or XL, and note what the size instinct would have counted instead.

Deliverable: Three repaired numbers, each with denominator, comparison and definition or a named gap, and a reach table in the form of the chapter's table with who is counted per unit.

Self-test

  1. A unit handles 400,000 transactions a year for 12,000 people. Which reach class does Contour give it?

    1. L, because it falls between 1,000 and 9,999 people
    2. It has no reach class until the transactions have been divided by the people they concern
    3. XL, because it touches 10,000 or more people, whatever the number of transactions
    4. XL only if the transactions rise to four million
  2. Why can ENISA's 4,875 incidents for the twelve months to June 2025 not be read as a fall from 11,079 the year before?

    1. Because the later report covers only public administration
    2. Because the two reports cover different member states
    3. Because the earlier count included incidents outside Europe
    4. Because the counts were produced under different versions of ENISA's methodology
  3. Where does the chapter say the rule of dividing stops applying?

    1. At the top row of the landscape: one irreversible outcome for one person is not made small by a rate
    2. In the bottom row, where everything is reversible at once
    3. For official statistics, which need no denominator
    4. For any unit of reach class S, because fewer than 100 people a year are too few to give a meaningful rate

Chapter 11 · 90 minutes

The Destiny Instinct: Nothing Here Is Fixed, and Nothing Is Inevitable

The lesson treats the destiny instinct in its two faces: architecture seen as fixed terrain and AI seen as a tide. It uses the dates of the AI Act that Regulation (EU) 2026/1744 moved, survey data on how often organisations change production, and the series' conclusion that reversibility decays, then reads the scenario year of both organisations in V2. The rule of thumb asks what was decided, by whom, and what it would take to reverse it.

Learning objectives

  • Explain the two faces of the destiny instinct and where each is useful.
  • State which dates of the AI Act Regulation (EU) 2026/1744 moved and which it left, as the chapter reports them.
  • Rewrite a sentence with a tide in it as a sentence with a seat in it.
  • Design a reversibility test for one function handed to an AI unit, following the chapter's steps.

Key concepts

The destiny instinct
A cousin of Rosling's instinct with two faces. The first sees architecture, the target architecture and the dates in the regulation as terrain. The second sees AI as a tide, where asking whether a particular use should exist is arguing with the sea.
Decision record
A dated note that says what was decided, by whom, why, and what it would take to undo. Where one exists nothing is fixed, because it says who could change it, and nothing is inevitable, because it shows the thing was chosen.
The moved date
Regulation (EU) 2026/1744, in force from 27 July 2026, moved the Annex III high-risk obligations from 2 August 2026 to 2 December 2027 and the Annex I ones from 2 August 2027 to 2 August 2028. The obligations themselves did not change.
Reversibility test
From AI Threat, Chapter 26, and AI Boss, Chapter 25: run per function handed to a unit. It asks whether the organisation could perform the function without the system for a defined period, and records passed, passed with conditions or failed.
Rule of thumb: what was decided
Nothing here is fixed and nothing is inevitable; ask what was decided, by whom, and what it would take to reverse it. A decision that stands is binding until remade on the record by someone with the authority to change it.

Teaching plan

10 minOpening: the teacher puts Question 12 to the room again and shows how its two wrong options are the two forms the instinct takes.
25 minLecture on the evidence with Figures 11.1 and 11.2: the dates that moved and those that did not, deployment frequency in the DevOps Research and Assessment vendor survey (unrelated to the EU regulation with the same acronym), GitOps, and reversibility that decays.
15 minGuided reading of Figures 11.3 and 11.4: Hansa Mutual's year with no trail and a seat that changes from 2 to 4, and Nordvik Region's year with a retired pilot and a trail to the left.
30 minExercise: participants write a decision record and plan a reversibility test for one delegated function.
10 minClosing: where the rule stops applying, and why the chapter says an organisation planning for a further deferral of 2 December 2027 has drawn the wrong conclusion.

Discussion

  1. The author describes a capability map whose top-level diagrams held for many years. How do you tell a diagram that is rightly stable from one that is merely treated as terrain?
  2. In Hansa Mutual's scenario the agent nearest the empty corner does not move, and the board moves towards it. What does a seat changing without the mark moving tell a reader that a count of agents would not?
  3. The chapter says inevitable is sometimes an accurate description of a delegation whose fallback has quietly gone. Which function in your organisation would you test first, and who would perform it again?

Exercise · 30 minutes

A decision and its way back

Choose one function your organisation has handed to an AI unit, or take the open-shift offers of Nordvik Region's rostering system NR-SW. First, find a sentence that describes it with the technology as the subject and rewrite it so that it names what was decided, by whom and at which level. Second, write a short decision record: what was decided, by whom, why, and what it would take to undo. Third, plan a reversibility test following the chapter's steps: name the function and the people who would perform it again, fix the period the organisation must manage without the unit, describe one cycle of the documented fallback in one team, state how the result will be recorded, and date the next test.

Deliverable: A rewritten sentence with a seat in it, a dated decision record with the path back, and a one-page reversibility test plan with function, people, period, fallback cycle and next test date.

Self-test

  1. According to the chapter, what did Regulation (EU) 2026/1744 change about the obligations for high-risk AI systems listed in Annex III?

    1. It repealed them and replaced them with voluntary codes
    2. It left the date at 2 August 2026 and removed recruitment and work allocation from the list in Annex III
    3. It moved them to 2 August 2028 together with the Annex I products
    4. It moved the date from which they apply to 2 December 2027; the obligations themselves did not change
  2. In Nordvik Region's scenario, what did the reversibility test of the open-shift delegation, run from 5 to 16 April 2027, find?

    1. That the rostering system had moved into the empty corner
    2. That the deputy had never planned a route by hand and the manual template lacked the travel-time rule
    3. That the fallback worked and the delegation could be extended at once
    4. That the supplier could not show how applications for care vacancies were ranked, so the pilot was paused
  3. Why does the chapter rewrite AI is being introduced into case handling as the head of the benefits unit decided to procure a triage system that ranks the queue at Level 0 Advisory?

    1. Because the second sentence has a seat in it, while the first has a tide
    2. Because the first sentence is false and the second is true
    3. Because the AI Act requires the second wording in public registers
    4. Because the second sentence names the model and the first does not

Chapter 12 · 90 minutes

The Single-Perspective Instinct: Security, Compliance and Productivity Share One Landscape

The lesson treats the single-perspective instinct: seeing only security, only compliance or only productivity. It shows that the surveys of leaders, workers, developers and the security record measure different things, then has the three chairs read Nordvik Region's one-page landscape and evidence view in their own orders, and runs the chapter's three-chair review in one meeting. The rule of thumb is to read the landscape from the other two chairs before deciding.

Learning objectives

  • Describe what each chair's survey measures: expectation, use and attitude, use and trust, and recorded incidents.
  • Read a one-page landscape in the order of the productivity, security and compliance chairs.
  • Interpret an evidence view as an auditor, an engineer and an elected member would.
  • Conduct a three-chair review and record its readings and decision against unit identifiers.

Key concepts

The single-perspective instinct
The habit of seeing only security, only compliance or only productivity, when the three sit on one landscape and move together. It is what expertise does to a reading, and it misleads when one chair decides for all.
Chairs measure different things
The leaders' vendor survey measures expectation and self-reported deployment, the workers' surveys use and attitude, the developers' survey use and trust, and the security record failure and attack. The gaps are gaps between chairs, not errors in one of them.
Three reading orders
Productivity reads colour, size and column: where the use is and whom it touches. Security reads shape, diamond and the empty corner. Compliance reads row, seat and baseline.
Three-chair review
One meeting: render V1 and V5 as of the meeting date, each chair reads aloud in its own order and names the one mark it would change first, each reads a mark another named, and the readings and decision go into one review record.
Rule of thumb: the other two chairs
Before you decide, read the landscape from the other two chairs. The rule is about sequence, not balance, and stops where the law has decided for one chair or where the other chairs are empty.

Teaching plan

10 minOpening: three participants read the three voices of the chapter's opening, the leader, the worker and the keeper of the incident record, and the room names what each figure measures.
20 minLecture on the evidence with Figure 12.1, chair by chair, labelling each source by kind. The teacher states what the evidence does not show: that decision-makers read from one chair.
15 minGuided reading of Figures 12.2 and 12.3: the three orders on Nordvik Region's V1, then the attestations column, the gates column and the red cell of its V5.
35 minExercise: groups of three run a three-chair review of one landscape and write the review record.
10 minClosing: groups report where two chairs named the same mark; the teacher introduces the fourth chair, the people whose work and cases the units touch.

Discussion

  1. The rule asks for sequence rather than balance and avoids the framing of a trade-off between security and productivity. What does that change in how a go-live decision is prepared?
  2. Two units at Nordvik Region have logs and tests but no gate, and the chapter says a test that does not block a release is information, not control. Where does your organisation have information it treats as control?
  3. Only 18 per cent of employed Eurobarometer respondents had received a detailed explanation of how digital technologies including AI manage activities in their workplace. Who would sit in the fourth chair in your organisation, and at which meeting?

Exercise · 35 minutes

A three-chair review in one meeting

In groups of three, take one landscape: your own organisation's V1 if you have drawn one, or Nordvik Region's V1 and V5 of 1 January 2027. Assign the productivity, security and compliance chairs. Each chair reads the landscape aloud in its own order: colour, size and column; shape, diamond and the empty corner; row, seat and baseline. Each then names the one mark it would change first. Where two chairs name the same mark, record that as the decision of the meeting. Then each chair reads the mark another chair named, in its own order. Write one review record against the unit identifiers, with the three readings, the decision, and the change to be made to the landscape model.

Deliverable: A one-page review record with unit identifiers, three readings, the mark each chair named, the decision and the resulting change to the model.

Self-test

  1. In Nordvik Region's evidence view of 1 January 2027, which units rest on attestations alone, and what do they have in common?

    1. NR-BT, NR-CS, NR-SA and NR-AWT; all four run gates and policies as code
    2. NR-CR and NR-CN; both have logs and tests but no gate
    3. NR-SW, NR-CA, NR-EWA and NR-TL; all four are operated by suppliers
    4. NR-AMB alone; it was switched on by vendors
  2. Where does the chapter say the rule of reading from the other two chairs stops applying?

    1. Where the law has already decided for one chair, and where the other chairs are empty
    2. Where the unit's reach is S, and where the unit is in pilot
    3. Where the supplier has attested the controls, and where the unit is Mode 0
    4. Where the productivity case is strong, and where the board has already approved
  3. How does the chapter characterise the leaders' figures from Microsoft's Work Trend Index 2025, such as the 81 per cent expecting agents within twelve to eighteen months?

    1. As official statistics on agent deployment in EU enterprises
    2. As a probability survey of executives in the 27 member states, with a sampling frame and weights
    3. As measured use, taken from the vendor's telemetry of tenants in the European Union
    4. As a vendor survey describing expectation and self-reported deployment, not measured use

Chapter 13 · 90 minutes

The Blame Instinct: When Nobody Designed Who Decides

The lesson treats the blame instinct: looking for the thing that acted last and stopping there. It starts from two drafts of a post-mortem on Hansa Mutual's failed stop drill, examines whom the AI Incident Database names and what it has no field for, relates Article 26(2) of the AI Act to the seat, and reads the decision-rights views of both organisations at the end of 2027. The rule of thumb is to look for the seat before the culprit.

Learning objectives

  • Explain why, where software acts, the thing that acted last is often not the thing that decided.
  • Describe what the incident record names, and state the limits of the author's classification of its entries.
  • Read a decision-rights view from the seats and identify rows at T0.
  • Draft the four lines written before go-live: the tier, the holder, the stop path with its budget, and the record.

Key concepts

The blame instinct
The habit, when something has gone wrong, of looking for an agent to hold responsible and stopping when one is found. Here the agent found is the model, the vendor or the agent software, because those acted last.
Moral crumple zone
The term of AI Boss for a human attached to a system's output who can absorb the blame without having had the means to decide. It is why a name is necessary and not sufficient.
Six capabilities of a decider
AI Boss defines the named human decider by six capabilities: identifiable, able to decide otherwise, informed, given time, protected, and answerable. The seat tells you whom to ask; the capabilities tell you whether the answer will be worth anything.
Stop path with a budget
Who may stop the unit without asking anyone, within how many minutes, with the switch kept outside the thing it stops, and drilled. If a stop needs a conversation, the budget is a fiction.
Rule of thumb: the seat before the culprit
Look for the seat before you look for the culprit; if nobody was named to decide, that is the finding. The rule stops applying where a person acted with intent, the largest category of recorded harm.

Teaching plan

15 minOpening: the teacher presents the first draft of the post-mortem on the stop drill that took seventeen minutes against five and asks for its recommendation, then presents the second draft and its one-sentence finding.
20 minLecture on the evidence with Figures 13.1 and 13.2: named organisations against unnamed categories, the three readings the record cannot tell apart, the proximate-cause and intent fields, and Articles 3(3), 3(4), 25(1), 26(2) and 26(5) of the AI Act as the chapter reads them.
15 minGuided reading of Figures 13.3 and 13.4 down the right-hand ends of the bars: seventeen rows and seventeen seats, thirteen rows and thirteen seats, and what each view looked like on 1 January.
30 minExercise: participants rewrite an incident finding and design the decision rights for one unit before go-live.
10 minClosing: the two outcomes of a failed stop. One organisation finds no seat for the budget and creates one; the other finds the seat and gives it hands.

Discussion

  1. The second draft finds nothing wrong with anyone and something missing from the design. Why is that draft harder to write, and what in your organisation's review practice favours the first?
  2. A seat on the ambient AI does not make it safe; it makes it somebody's. What changes in practice once a row at Level 4 has a named holder, and what still does not?
  3. The chapter says an organisation that starts from the record writes a name into a field, while one that starts from the tier and the stop path may discover the name was wrong. What does the order of the four steps protect against?

Exercise · 30 minutes

Four lines before go-live

Part one: take an incident report from your organisation with a system in its title, or the first draft of Hansa Mutual's post-mortem. Rewrite its principal finding after asking who had been named to decide that the unit may act at that level, who had been named to decide that it stop, and whether a record dated earlier says so. Part two: for one unit that acts at Level 3 Bounded or above, or the unit in your report, write the four lines in the chapter's order: the tier, from the reversibility and reach of its actions; the holder, by role, checked against the six capabilities; the stop path, with who may stop without asking, the budget in minutes and where the switch sits; and the dated record. Draw the unit's row as a V4 with its seat.

Deliverable: A rewritten finding that names the seat or its absence, and a dated decision record with tier, holder, stop path and budget, with a hand-drawn V4 row.

Self-test

  1. What is the one-sentence finding of the second draft of the post-mortem on Hansa Mutual's stop drill?

    1. The agent is unfit for its autonomy
    2. Nobody has been named to decide the time to stop
    3. The duty analyst failed to apply the deny rule in time
    4. The supplier shipped credentials with too long a validity
  2. After Nordvik Region's first out-of-hours stop drill of the benefits-triage system took 26 minutes against a budget of 15, what was the remedy in the scenario?

    1. The regional executive committee took the decision right over the system at T4 and asked for quarterly drill figures
    2. The system was retired and the ranking returned to caseworkers
    3. The managed security service provider received a break-glass credential for one action; the seat stayed put
    4. The budget was raised to 30 minutes and the drill was not repeated
  3. The author sorts the thirty most frequent alleged deployers in the AI Incident Database into named organisations and unnamed categories. What does he say the resulting figure shows?

    1. Whom the public blames after an incident involving AI
    2. How often a decision right had been designed before the incident
    3. That organisations cause fewer incidents than individuals do
    4. How the record is labelled, not whom it blames; the split is partly an artefact of the labelling

Module 3 · Part III · Drawing Your Landscape

Part III is practical. The participant draws a one-page landscape from the records the organisation already keeps, reads a year of change in the time view, places the same marks by supplier role and jurisdiction, reads who decides and where the proof comes from, and compares two landscapes at the end of a modelled year. Each lesson produces an artefact of the kind the chapter describes: a V1 with its list of gaps, a V2 with timeline notes, a V3, a decision record with V4 and V5 rows, and a V6 with a review plan.

Lecture · 50 minutes

Drawing your landscape: from records to six views

The lecture carries the argument of Part III: a landscape is a join of records that already exist, and the gaps in the join are the finding. It follows one unit, Nordvik Region's rostering system, through all the views: populated from the inventory and the delegation profile, moved one column in the time view with its controls in place first, placed with an EU application supplier, read in the decision-rights and evidence views, and compared with Hansa Mutual at the end of the scenario year. It closes on what the views show and what they refuse to say.

10 minA join of records, and the gaps as the finding
  • The AI inventory, the mandate, the delegation register, the contracts and the proxy logs each answer different fields of the model.
  • Reversibility and reach are assessed, not copied: the action the unit takes or shapes, and people, never transactions.
  • Unknown fields are drawn as absences or as the worst defensible case with a note. The unit is never left out.
  • The list of absent seats, absent diamonds at Level 3 and above, dashed baselines at R3 and not decided is the deliverable, not the figure.
10 minA year: trails, and what trails leave out
  • A trail is drawn for a change of column or row and for nothing else.
  • Drift shows as a trail whose end lacks a filled diamond, a seat or a solid baseline; decay as a row that should have moved up and did not.
  • The rostering system's policy point is enforced on 20 January and its level rises on 11 March: control before autonomy.
  • Hansa Mutual's year has no trail and four changes of control, so V2 is read together with V4 and V5 at both dates.
10 minWhere it runs and under whose law
  • Four roles: model provider, hosting, application and operations. Suppliers are containers labelled by role and jurisdiction, never by brand.
  • Solid for the organisation's own boundary, dashed for a supplier, dotted for a jurisdiction outside the EU and the EEA; an EU region of a non-EU vendor is drawn dotted.
  • The mark always belongs to the organisation: it is the deployer of every mark on its landscape, as the chapter reads the AI Act.
  • The supply side of the market is not officially measured; V3 is the measurement an organisation can make for itself.
12 minWho decides, and how we know
  • V4: a bar to the ceiling, thin bars per action class, a diamond where a policy point enforces, a seat with the holder's tier.
  • Three conclusions become drawing rules: a name is necessary and not sufficient; Level 3 without a policy point is Level 4 with a misleading label; attestation is not evidence.
  • V5: filled cells for what the system produces, hatched for what a person or supplier declares, a red none where there is neither.
  • The stop path has no symbol; it appears as a drill result, a number nobody can declare.
8 minTwo landscapes compared, and no ranking
  • The comparison frame draws both at identical scales with one legend and forbids rescaling.
  • The Region's year is motion and the group's is seats; the summary strips count diamonds, seats and baselines and are not added up.
  • The frame shows who holds the seats and where the proof comes from, and withholds a verdict on who is ahead.

What the audience takes away

  • Start from the records you already keep, draw every unit, and treat each gap as a finding with an owner and a date.
  • Read a year in V2 for movement and in V4 and V5 for control; the changes that matter most often leave no trail.
  • A seat is real when its holder can produce a recent measured time for a stop, from a drill and not from a design.

Chapter 14 · 120 minutes

The One-Page Landscape: Drawing It From What You Already Have

The lesson shows how to draw a one-page landscape from records an organisation already keeps: the AI inventory, the mandates, the delegation register, the contracts and the proxy logs. Participants learn which record fills which field of the landscape model, how to assess reversibility and reach, how to find the seat, and how to draw what nobody knows. The deliverable of the work is the list of gaps, not the figure.

Learning objectives

  • Map the fields of the landscape model to the records that fill them.
  • Assess the reversibility tier and the reach class of a unit using the chapter's rules.
  • Find the seat of a unit by asking the chapter's three questions and translate the role into a tier.
  • Draw unknown fields as absences or as the worst defensible case, and list the resulting gaps.

Key concepts

A join of records
A landscape is a join of records that already exist: the AI inventory, the mandate, the delegation register, the contracts, the proxy logs and the decision records. The places where the join fails are the first things the picture has to say.
Assess the action, not the breach
Reversibility is assessed on the action the unit takes or shapes, at its hardest-to-reverse class. What a compromised version could do belongs in the threat register. A Level 0 Advisory unit can sit at R3 because of the outcome its suggestion shapes.
Three questions for the seat
Who may raise or lower its autonomy level? Who may stop it today without asking anyone? Who answers for it? Where the answers differ, the seat carries the holder of the first. The seat names a tier, not a competence.
Worst defensible case
The convention for mode, level, reversibility and reach, which have no unknown value. Where nobody decided the level, draw the unit at the level its permissions allow and write level not decided in the notes, so the mark is challenged.
Timeline
The unit's top-level fields give its state at the start of the period; change is a list of dated entries that carry only the fields that changed. The renderer applies the entries up to the date it is asked for.

Teaching plan

10 minOpening: the Friday afternoon of Nordvik Region's AI architect with three documents open, and the two marks that were on none of them.
25 minLecture: the four kinds of record, the table from record to model field, the rules for reversibility and reach, the three questions for the seat, and the stop path as the field that migrates to evidence.
15 minWorked example: the teacher reads the rostering system's entry in Nordvik Region's model from the top, then its two timeline entries, and shows how each line appears in the mark.
55 minExercise: participants populate a first landscape for their own organisation from the records they have, draw it by hand and list the gaps.
15 minClosing: each participant reads out the first three lines of their list of gaps; the teacher contrasts Nordvik Region's afternoon by hand with Hansa Mutual's pipeline.

Discussion

  1. Nobody curates the proxy logs, which is why they find what the other records missed. Which record in your organisation would show the AI uses nobody registered?
  2. The risk class is the one field the notation refuses to draw; the model keeps it in the description. What would be lost if high-risk were drawn as a colour or a border?
  3. Hansa Mutual's pipeline means a unit cannot be forgotten, yet it draws what the records say and nothing else. How would you check by hand whether the page is the whole landscape?

Exercise · 55 minutes

A first landscape from what you have

Follow the architect's six steps for your own organisation, or for Nordvik Region if you have no records to hand. Make one unit per inventory entry, naming the use and not the product. Add a unit with no seat for each AI service nobody registered and one Mode 0 unit for each family of features a vendor switched on. For each unit, write the level per class of action, the hardest action and what undoing it would take, the reach in people, the seat and the evidence. For every field you cannot fill, use the unknown value or the worst defensible case with a note. Draw the V1 by hand, then list every absent seat, every absent diamond at Level 3 and above, every dashed baseline at R3 and every not decided.

Deliverable: A hand-drawn V1 of at least five units with a legend, a table of the units' fields with their source records, and the list of gaps.

Self-test

  1. Nordvik Region's benefits-triage system only ranks a queue while caseworkers decide every case. Why does its mark sit at R3 Hard to reverse?

    1. Because the queue it ranks sets how long an applicant waits, and the row follows the outcome it shapes
    2. Because a compromised version of the system could delete case files
    3. Because it is a high-risk AI system under Annex III, and the notation draws every such system at R3 or above
    4. Because it handles about 40,000 applications a month
  2. Nobody has decided the autonomy level of a unit. According to the chapter, how is it drawn?

    1. It is left out of the landscape until a named person has decided the level and recorded it
    2. At Level 0 Advisory, as the most cautious assumption
    3. In the empty corner, with a red outline
    4. At the level its permissions allow, with level not decided written in the notes
  3. When is the baseline for a unit's stop path drawn solid, according to the chapter?

    1. When the mandate contains a paragraph describing the stop path
    2. When the supplier has confirmed the stop path in the contract
    3. When the stop has been run in a drill and logged
    4. When an executive at T3 holds the seat

Chapter 15 · 90 minutes

The Landscape Over a Year: Reading Change

The lesson teaches the time frame and V2, the landscape over time. Participants learn what a trail draws and what it leaves out, how drift between usage modes and decay of reversibility appear, how new and retired marks are drawn and misread, how to label statements about the coming year, and the quarterly routine of five questions, using the scenario year 2027 of Nordvik Region and Hansa Mutual.

Learning objectives

  • Read a V2 view, distinguishing changes a trail shows from changes it cannot show.
  • Explain drift with the controls left behind and decay of reversibility, and how each appears on a landscape.
  • Apply the five questions of the quarterly routine to a year of change.
  • Label a statement about the next year as observable, expected or speculation, with the reason.

Key concepts

What a trail draws
A trail is drawn for a change of column or row and for nothing else. A change of colour, size, shape, diamond, seat or baseline is shown as it stands at the later date and found by holding the later picture against the earlier one.
Drift
The drift of a unit between usage modes, from AI Governance, Chapter 2: a use moves from a prompt to a shared skill, a product, an automation, while the controls stay where the use started. On V2 it shows as a red outline at the end of a trail.
Decay
A mark whose row should have moved up and did not. No change event fires. It is caught only by a period of doing the work without the system, not a review of documents. The series illustrates the decay and does not measure it.
An honest trail
A trail is only as honest as the two measurements at its ends. If the question, the scale or the assessor changed between the dates, the line is partly an artefact. The model's timeline notes record who changed what and why.
The quarterly routine
Render V2 every quarter with the same start date, then ask five questions: what moved right and what travelled with it, what should have moved up, what changed colour, what is new or retired, and what changed that no trail can show.

Teaching plan

10 minOpening: the teacher shows Nordvik Region's V1 at the start and end of 2027 side by side and asks the room to find what moved before showing Figure 15.1.
25 minLecture: the trail and its limits, a year in the data with Figure 15.2 and the break-in-series flag on the Netherlands, drift, decay with the two reversibility tests, and new and retired marks.
10 minGuided reading of Figure 15.3: Hansa Mutual's year with no trail, and its four timeline entries read as changes of seat and baseline.
35 minExercise: participants draw a V2 for a year and answer the five questions on one page.
10 minClosing: participants label three statements about next year with one of the three labels and defend the label; the teacher uses the chapter's own examples.

Discussion

  1. At Nordvik Region the controls of the rostering system arrive on 20 January and the level follows on 11 March. What would the picture have shown if the order had been reversed?
  2. The chapter says decay is the one movement the model cannot show unless somebody measures it. For a unit at R1 or R2 in your organisation, when was the work last done without the unit?
  3. Eleven marks at the start and thirteen at the end sounds like growth. What do the new and retired marks of Nordvik Region's year say when read by position and not by count?

Exercise · 35 minutes

A year on one page

Using the landscape you drew for your own organisation, or Nordvik Region's with the changes the chapter lists, choose a start date and an end date a year apart, or a quarter if your records are short. Draw the V2 by hand: a hollow outline, a thin line and a filled mark for each unit that changed column or row, a new tick, a hollow mark with a cross for each retirement, and the two dates in a strip. Then answer the five questions in order on one page. For each trail, tick, cross and changed seat, write the timeline note that names the decision behind it; where you cannot, mark the note as missing. Finally, write one statement about the coming year and label it observable, expected or speculation.

Deliverable: A hand-drawn V2 with two dates, a one-page answer to the five questions with a timeline note per change, and one labelled statement about the next year.

Self-test

  1. Which of these changes during a year does a trail in V2 draw?

    1. A seat rising from T2 to T4 after a failed stop drill
    2. A unit moving from Level 2 Supervised to Level 3 Bounded
    3. A baseline turning from dashed to solid when logs are retained
    4. A unit growing from reach S to reach M
  2. The chapter labels one statement about the future as observable. Which one?

    1. That the next Eurostat survey will report a higher share of enterprises using AI than 19.95 per cent
    2. That agents will take over the decision of benefit cases
    3. That the share of enterprises using AI will keep rising at the 2024 to 2025 pace
    4. That the AI Act's obligations for Annex III high-risk uses apply from 2 December 2027
  3. In the scenario, neither reversibility test fails outright. What does the chapter say follows for the two models?

    1. In neither model does a row move; the finding sits in the conditions and the freezes
    2. Both marks move up one row, from R2 to R3
    3. Both units are retired and drawn hollow with a cross
    4. Both tests are discarded because they were run after go-live

Chapter 16 · 90 minutes

Supply, Sovereignty and Jurisdiction: Where the Landscape Runs

The lesson teaches V3, the supply and sovereignty view: the same marks placed in the container of whoever operates them. Participants learn the four supplier roles, why suppliers are drawn by role and not by brand, the solid, dashed and dotted borders and the model chip, what the AI Act, DORA and the GDPR add as the chapter attributes them, what the evidence on cloud supply can and cannot show, and how to draw a first supply view in an afternoon.

Learning objectives

  • Name the four roles a supplier can play for a unit and place a unit in the right container.
  • Explain why a global vendor's EU data region is drawn as a non-EU jurisdiction.
  • Relate the AI Act's roles, DORA's register of information and the GDPR's transfer rules to what V3 draws, as organisational implications.
  • Draw a first supply view from the contracts register and list what could not be placed.

Key concepts

Four answers to where it runs
The model: who trained the weights and where they are served. The hosting: on whose computers, in which country. The application: who built and supplies the software around the model. The operations: who runs the service day to day and holds the credentials.
Roles, not brands
A supplier container carries a role and a jurisdiction and nothing else. Brands change, one brand plays different roles in different units, the law attaches to roles, and a brand invites the model instinct.
Solid, dashed, dotted
A solid border is the organisation's own boundary, a dashed border a supplier labelled by role, a dotted border a jurisdiction outside the EU and the EEA. The borders nest, and a model chip marks a model taken from another supplier.
The mark belongs to the organisation
The supplier is never a mark; it is a container. The organisation is the deployer in the AI Act's terms of every mark on its landscape, including those in non-EU containers, and the mark sits in the container of whoever operates the unit.
Sovereignty as verifiable properties
From AI Platform and Security, Chapter 13: knowing where workloads run, which law governs them, being able to move them and being able to continue if a provider fails. The containers answer the first two; the other two are asked of every dashed container.

Teaching plan

10 minOpening: the claims handler in Hansa Mutual's Swiss subsidiary asks the claims assistant a question. The room traces where the question travelled and what the screen did not say.
25 minLecture: the four roles, the three borders, the EU data region case, the four things jurisdiction changes, and what the AI Act (Articles 2, 3 and 25), DORA (Article 28(3)) and the GDPR (Articles 44 to 46) add, as implications, not legal advice.
10 minThe evidence and its gap: Figure 16.2 on buyers by Member State, and why the supplier-side estimates of Figure 16.3 are one vendor's press-release data, restated between releases.
35 minExercise: participants draw a first supply view and read its dotted containers first.
10 minClosing: the UK and Swiss subsidiaries that have no container, and the Mode 0 mark in the container labelled various that both organisations share.

Discussion

  1. Of the four things jurisdiction changes, the author would ask first whether the stop path is within reach. Why that one, and how would you find the answer for a unit in a dotted container?
  2. The book found no official statistic of who supplies Europe's cloud and model services and says a dependence that is not measured is not governed. What can an organisation measure for itself?
  3. A jurisdiction can enter a landscape through the people who use a unit and the data they bring, without hosting a single mark. Where does that happen in your organisation?

Exercise · 35 minutes

A first supply view

Take the units of the landscape you drew for your own organisation, or Nordvik Region's units as the chapter places them. For every unit, ask the four questions and write the answers as roles: who supplies the model, who hosts it, who supplies the application, who operates it. Give each supplier an identifier, a role, a jurisdiction (EU, EEA or non-EU) and a generic label that says what it does and not who it is. Add one entry for the vendors nobody chose, with the location various where that is the honest answer. Draw the view by hand: a shaded EU and EEA area, your own solid boundary, dashed supplier boxes, dotted jurisdiction containers and model chips. Read the dotted containers first and write down what you could not place.

Deliverable: A hand-drawn V3 with suppliers labelled by role and jurisdiction, never by brand, a supplier table, and a list of units whose model, hosting, application or operations could not be named.

Self-test

  1. How does V3 draw a unit hosted in the EU data region of a global vendor, and why?

    1. Inside the EU and EEA area with a dashed border, because the data stay in the Union under the contract
    2. Inside the organisation's solid boundary, because the organisation is the deployer
    3. It is left off the view until the vendor confirms the location in writing
    4. In a dotted container, because the contract is with a company governed by its home country's law
  2. Why do Hansa Mutual's UK and Swiss subsidiaries have no container in its supply view?

    1. Because the AI Act does not apply directly in those two countries, so the notation leaves them out
    2. Because the renderer draws a supplier's container only where a unit sits in it, and no unit does
    3. Because the subsidiaries use no AI at all
    4. Because their units are counted inside the container labelled various
  3. How does the chapter characterise the estimate that European providers held around 15 per cent of the European cloud infrastructure market?

    1. As one market research vendor's press-release estimate from a proprietary model, not an official statistic
    2. As a Eurostat figure from the survey of enterprises with ten or more persons employed
    3. As a measurement the Commission made for its Digital Decade dashboard
    4. As a forecast by the book's author for the year 2035

Chapter 17 · 105 minutes

Decision Rights and Evidence: Who Decides, and How We Know

The lesson teaches V4, the decision-rights view, and V5, the evidence view. Participants learn to read the seat and its tier, the ceiling and the thin bars per action class, the diamond and the stop path, and the difference between filled and hatched cells. They read the views as a board member, an auditor and an engineer would, and carry out the chapter's one-page review of a unit, ending in a decision record.

Learning objectives

  • Read a row of a decision-rights view: ceiling, action classes, policy point, seat and shaded cells.
  • Test a named holder against the six capabilities before a seat is drawn.
  • Distinguish verified, declared and failed controls, and filled from hatched cells in an evidence view.
  • Review one unit in six steps and write the decision record and its evidence row.

Key concepts

Decision right
The authority to say what an AI use may do, to change that, and to stop it. A decision right without evidence is a hope; evidence without a decision right is a report nobody has to act on.
Ceiling and action classes
The thick bar in V4 is the unit's ceiling: the highest autonomy level at which it may act for any action that changes something. Each thin bar is one action class with its own level. The seat sits at the end of the bar.
Stop path
The named people who may stop the unit, the mechanism they use and the time it takes. Contour gives it no glyph: the decision record names it, the drill measures it, and the evidence view shows it as a test result.
Evidence and attestation in V5
A filled cell is automatic evidence: a log, a test, a gate. A hatched cell is attested: a questionnaire answer, a contract clause, a signature. A hatched cell alone on a unit at R3 Hard to reverse is the question to ask.
Verified, declared, failed
A control is verified when a test that re-runs its scenario has passed recently and produced evidence by operation, declared when somebody says so, and failed when the test ran and did not pass. The evidence manifest behind each cell holds the result.

Teaching plan

10 minOpening: the board meeting of 31 March 2027 at Hansa Mutual. The board asks one question, how long it takes to stop each agent, and moves a seat while the agent stays unchanged.
25 minLecture on V4 with Figures 17.1 and 17.2: the tiers T0 to T4, the three seats that move, the six capabilities, the SOC investigation agent's thin bars, the shaded Level 4 cells, and why the stop path has no symbol.
20 minLecture on V5 with Figures 17.3 and 17.4: Nordvik Region's pattern of building a little and buying a lot, and the three changes by the end of the year, including the supplier evidence schedule drawn hatched.
40 minExercise: participants review one unit in the six steps and write its decision record and evidence row.
10 minClosing: three participants read their record as a board member, an auditor and an engineer would, and each states the one question their reader would ask.

Discussion

  1. The chapter says a seat for someone who could not in practice stop the unit is worse than none. What does the board believe when it sees such a seat, and how would the six questions have prevented it?
  2. Contour refuses to draw the stop path as a symbol because a symbol would say there is a kill switch with nothing behind it. What does your organisation currently accept as proof that a unit can be stopped?
  3. Hansa Mutual's leverage is its platform and Nordvik Region's is the contract. Which describes your organisation, and what does that imply for turning hatched cells into filled ones?

Exercise · 40 minutes

A one-page review of one unit

Choose the mark that worried you most in your own landscape: a square at Level 3, a mark without a seat or a dashed baseline at R3. If you have none, take Hansa Mutual's IT-operations agent. Follow the six steps. Name the unit and list its action classes with their reversibility tiers. Set the ceiling per class with the reason, writing found, not decided where nobody set it. Name the holder and tier and test the name against the six capabilities. Find the policy point and trace the stop path: who, by what mechanism, within what budget, last drilled when and with what result. Sort the evidence into logs, tests and evaluations, gates and policies as code, and attestations. Write the finding in one sentence and the events that reopen the review.

Deliverable: A one-page decision record with holder, tier, ceiling per class, policy point, stop path and reopening triggers, plus the unit's hand-drawn rows in V4 and V5.

Self-test

  1. Between 1 January and 31 December 2027, Hansa Mutual's ambient AI row gains a seat reading 2 while its bar stays at Level 4 Autonomous. Why is the bar unchanged?

    1. Because the executive board decided, on 31 March, to keep the vendors' features at Level 4
    2. Because a policy point now enforces the Level 4 ceiling
    3. Because the group cannot change what a vendor's product does; it can only add a seat
    4. Because the renderer draws Mode 0 units at Level 4 whatever the model says
  2. Why is Nordvik Region's supplier evidence schedule for the benefits-triage system drawn as a hatched cell in V5?

    1. Because it is a dated set of declarations about the supplier's side: the supplier's word, next to the Region's own logs
    2. Because the stop drill behind it failed its budget when re-run
    3. Because the benefits-triage system produces no logs of its own
    4. Because the schedule has not yet entered into force
  3. In the review of one unit, what follows from a no to any of the six capabilities of the named holder?

    1. The seat is drawn with a red outline
    2. The seat is drawn one tier higher than the holder's role
    3. The unit must be retired before the next quarter
    4. The seat is not drawn until every answer is yes

Chapter 18 · 105 minutes

A Year at Nordvik Region and Hansa Mutual: Two Landscapes Compared

The lesson follows Nordvik Region and Hansa Mutual through the modelled year 2027, from the comparison view of 1 January to that of 31 December, with the time, decision-rights and supply views in between. The Region's year is drawn as motion and the group's as seats. Participants learn what the comparison frame shows and what it refuses to produce, and how to run the year-end landscape review that yields these figures.

Learning objectives

  • Compare two landscapes in a V6 view in the thirty-second order without ranking them.
  • Explain why the order of control before autonomy keeps the rostering system's trail clean.
  • Interpret the summary strips and state what they do not add up.
  • Plan a year-end landscape review using the chapter's eight steps.

Key concepts

The comparison frame
It draws two landscapes at identical scales, sizes and colours, with one legend between them, and forbids rescaling either to fit. It makes visible who holds the seats and where the proof comes from, and withholds a ranking.
Summary strip
The counts under each landscape in V6: units per mode and per level, and marks with a filled diamond, a seat and a solid baseline. A change of tier still counts as a seat, and the strips are not added up into a score.
Control before autonomy
Nordvik Region's rostering system has its policy point enforced on 20 January, seven weeks before one action class rises to Level 3 Bounded on 11 March. In the other order the mark would carry the thin red outline for seven weeks.
A year of motion, a year of seats
The Region's year has two new marks, two trails and one retirement. Not one of the group's seventeen marks moves; its changes are a seat rising to 4, a seat rising to 3, a baseline turned solid and a seat added to its ambient AI.
Year-end landscape review
Eight steps: fix two snapshot dates, add a timeline entry on the day of each change, render the views, write one line per trail, tick and cross, check seats and baselines of unmoved marks, explain each strip number, note what the pictures omit, and set next year's dates.

Teaching plan

15 minParticipants read Figure 18.1 in the thirty-second order in pairs, one panel each, and report: the empty corner, squares at Level 3 and above, marks without a seat, dashed baselines at R3, colours.
25 minThe teacher tells the year with Figures 18.2 to 18.5: the Region's order of diamond and level, the trail that goes down, the group's seats in March and April, the two grey marks seated, and 2 December 2027, which leaves no trace in any figure.
15 minPairs read Figure 18.6 in the same order and explain each number that moved between the two summary strips in one sentence.
40 minExercise: participants compare two landscapes side by side and plan a year-end review for their own.
10 minClosing: what the frame does not show, and why the chapter's one general conclusion is a statement about design and not a forecast.

Discussion

  1. The same blind spot is named in both organisations in the same year, and the result is a grey square at Level 4 with a small 2 above it; the Region's diamond is hollow and the group's absent. What explains the difference in the diamond?
  2. The frame does not weigh one XL square at R3 against six S circles at R1 and leaves the weighing to the reader. Who in your organisation should do that weighing, and with which other information?
  3. Nothing in the notation records the extension of the agent-boss pilot's mandate to 30 June 2028. What else about a year would you write under what the pictures do not show?

Exercise · 40 minutes

Two landscapes, no ranking

Work in pairs. Each of you brings the hand-drawn V1 of an organisation: your own, or one of you takes Nordvik Region and the other Hansa Mutual from Figure 18.1. First redraw the two side by side at identical scales and sizes with one legend, and write a summary strip under each: units per mode and per level, and the number of marks with a filled diamond, a seat and a solid baseline. Read the pair in the thirty-second order and write five differences as differences of position, shape, colour, diamond, seat and baseline, without a verdict on which is better governed. Then, for your own landscape, write a plan for a year-end review following the eight steps: the two snapshot dates, who adds timeline entries, which views are rendered, and what the pictures will not show.

Deliverable: A hand-drawn V6 with shared legend and two summary strips, five written differences with no ranking, and a one-page year-end review plan.

Self-test

  1. In the scenario, what happens to the mark of Hansa Mutual's IT-operations agent HM-ITO on the grid on 31 March 2027?

    1. It moves from Level 3 Bounded to Level 2 Supervised, because the stop drill took 17 minutes against a budget of 5
    2. Nothing moves; the seat above it changes from 2 to 4 when the executive board takes the decision right
    3. It moves from R3 Hard to reverse to R2 Reversible with effort
    4. It is drawn hollow because the agent is paused until the next drill
  2. What do the summary strips of Figure 18.6 report for Nordvik Region across the year?

    1. Filled diamond 16 before and after, seat 16 then 17, solid baseline 12 then 13
    2. Filled diamond 11 then 13, seat 11 then 13, solid baseline 11 then 13
    3. Filled diamond 7 then 11, seat 10 then 13, solid baseline 6 then 8, of 11 and then 13 marks
    4. Filled diamond 3 then 0, seat 1 then 0, solid baseline 4 then 0
  3. Which trail is the only leftward trail in either landscape during 2027?

    1. The rostering system NR-SW, from Level 3 Bounded to Level 2 Supervised
    2. The agentic work tools NR-AWT, from Level 2 Supervised to Level 1 Assisted
    3. The claims-triage agent HM-CT, from Level 3 Bounded to Level 2 Supervised
    4. The citizen-service assistant NR-CS, from Level 4 Autonomous to Level 3 Bounded

Module 4 · Part IV · Seeing Clearly

Part IV turns the book into practice and looks ahead. The participant applies the nine rules of thumb to five kinds of document, as an executive, an architect, a public official, a journalist and a citizen would, and then sorts the next years under the labels observable, expected and speculation. The module ends with a projection written so that it can be shown wrong, the test retaken with reasons, and a dated list of what to do on Monday.

Lecture · 40 minutes

Seeing clearly: nine questions, three labels and Monday

The lecture carries the argument of Part IV. The rules of thumb do not replace the landscape; they are what to ask of it, and of any document that describes it without drawing it. The lecture takes one board paper apart with the rules, shows how each of five readers starts from the word that triggers an instinct, then sorts the next years under three labels and shows the form of a projection that can be wrong on the record. It closes with the possibilist stance: the facts allow a reasonable hope and demand work.

10 minOne board paper, nine questions
  • The AI is now automated across claims handling becomes seventeen units, three of which touch claims handling at scale, at stated levels.
  • Our model becomes a use reclassified under Annex III point 4(b) while the model does not change.
  • A dashed line to 2030 on two measured years is labelled speculation; the Commission's four baselines are the public example of a line redrawn every year.
  • The rewritten paragraph is longer and is the first version a board could act on.
8 minFive readers, one checklist
  • The architect makes a rise to Level 3 Bounded conditional on a filled diamond, a solid baseline and a tested fallback.
  • The public official answers rogue AI with a base rate of 3 in 1,498 and points to the quiet harm in the R3 row.
  • The journalist names the gap: the count rose, and whether the rate did, nobody can say.
  • The citizen asks the seat's question at work: who decides, and who can be asked to decide otherwise.
12 minThe next years under three labels
  • Observable: adoption at 19.95 per cent of enterprises in 2025, recorded harms that are quiet, and the AI Act's dates as amended in 2026.
  • Expected, each with its evidence: a recomputed Commission trajectory, a higher share at the next survey, agents arriving at buyers as features, seats on high-risk marks.
  • Speculation, kept short and written down: an agent at Level 3 on a resident's case, a further deferral, a system escaping control.
  • A projection carries its label and what would show it wrong; the chapter's own are marked in the manuscript for the author's confirmation.
10 minA reasonable hope, and Monday
  • The picture is quieter than either story told about it, and the designs that govern agents exist: a policy point, a named person, evidence the system produces.
  • None of it happens by itself: the grey square without a seat, the dashed baseline, the missing denominator.
  • Monday: count the units, place them, look at the empty corner, name the seats, test the promises, ask the suppliers, label next year, and render again in a quarter.

What the audience takes away

  • The nine rules are questions a meeting can put to any document about AI before it decides on it.
  • Label every sentence about next year, and write projections so that they can be wrong on the record.
  • The facts allow a reasonable hope and demand work; the picture is the instrument for both.

Chapter 19 · 105 minutes

The Rules of Thumb in Practice

The lesson collects the nine rules of thumb, each with one measured fact, maps the fourteen test questions to the chapters that explain them, and follows five readers through five documents: an executive with a board paper, an architect with a proposal to raise a level, a public official facing a question about rogue AI, a journalist with a press release and a citizen with a headline. Participants apply the nine rules as questions a meeting can put to any document about AI.

Learning objectives

  • State the nine rules of thumb and the instinct each answers.
  • Select the rule that fits the word or figure in a document that triggers an instinct.
  • Rewrite a paragraph about AI so that it names units, levels, seats and baselines and labels its projections.
  • Apply the nine questions in order to a real document before a decision is taken on it.

Key concepts

The nine rules as questions
Which ones, and how many; at which level, for which action; used for what and deployed by whom; what bent the last curve; what base rate and what quiet harm; divided by what; what was decided, by whom, and what would reverse it; what the other two chairs see; who held the seat.
The trigger word
Each reader begins with the rule that fits the word that triggered an instinct: the AI, automated, our model, a dashed line, a frightening story, a lone count, rogue, a paper from one chair, a culprit.
A paper a board could act on
Rewritten with the rules applied, the board paper's first paragraph names three units at stated levels, seats and baselines, says which allocation function is under reassessment and makes no projection. It is longer, and the first version a board could act on.
The honest sentence
The journalist's sentence that names the gap: the incident count rose from 313 for 2024 to 463 for 2025, and whether the rate did, nobody can say from these figures, because no public dataset counts deployments.
The seat's question at work
The rule the citizen can act on: who decides when a device allocates a shift or scores a quarter, and who can be asked to decide otherwise.

Teaching plan

15 minRecall: participants write the nine rules from memory, then check them against the chapter's list, each with its measured fact. The teacher shows the table that maps the fourteen questions to chapters.
25 minThe teacher walks through the executive's and the architect's scenes: three sentences of a board paper taken apart rule by rule, and a rise from Level 2 to Level 3 made conditional on the diamond, the baseline and the reversibility test.
15 minGroups of three take the public official, the journalist and the citizen. Each reads its scene and reports which rules were used, in which order, and the sentence the reader ends with.
40 minExercise: participants put the nine questions to a real document and rewrite its opening paragraph.
10 minClosing: which rule each organisation most needs. Hansa Mutual the ninth; Nordvik Region the fifth and the seventh. Each participant names the one their own organisation most needs.

Discussion

  1. The rewritten board paper is longer. What does a board lose and gain when the first paragraph names three units at stated levels and seats where it used to say the AI is automated?
  2. The councillor's fear was not foolish; it was about the wrong mark. How can an official answer a frightening question in a way that redirects attention without dismissing it?
  3. The citizen's survey, read from the other chairs, gives figures the headline left out. Which of the figures in that scene would you want beside the headline, and why?

Exercise · 40 minutes

Nine questions for one document

Bring a real document about AI that is waiting for a decision or a reaction in your organisation: a board paper, a proposal, a council question, a press release or a news article. Mark every trigger word or figure in it. Put the nine questions to it in the order the chapters set them and write a one-line answer to each, or write that the document does not say. Where the document describes a landscape without drawing it, sketch the units it mentions as marks on the grid. Then rewrite its opening paragraph so that it names the units, their levels, seats and baselines, gives every number its denominator and source, and labels any statement about the future as observable, expected or speculation.

Deliverable: The annotated document, nine one-line answers, a hand sketch of the units it mentions, and a rewritten opening paragraph with labelled statements about the future.

Self-test

  1. In the executive's scene, the board paper says the AI is now automated across claims handling in all markets. What does the second rule find?

    1. That the sentence is true of every action of the three units that touch claims handling
    2. That the sentence is false, because no unit at Hansa Mutual acts above Level 1 Assisted
    3. That it is true of routing, false of settlement and misleading about drafting
    4. That the sentence cannot be assessed without the name of the model
  2. How does the regional director answer the question whether the Region's rogue AI could decide about a resident's benefits without a person?

    1. No system decides about a resident's benefits; one orders the queue in which people decide
    2. The benefits-triage system decides only the simple cases, at Level 3 Bounded, and hands the rest to caseworkers
    3. The Region has paused all its AI until the audit committee reports
    4. The question cannot be answered because the supplier will not show the ranking
  3. A press release says 463 AI incidents were recorded in 2025, up from 313 in 2024, and that the trend is accelerating. What does the fourth rule say about the second claim?

    1. That the trend is confirmed, because both counts come from the same database
    2. That the trend is false, because the counts fell after revision
    3. That the trend applies to Europe only, where most incidents are located
    4. That two points do not make a trend; what bent the curve is partly adoption, partly attention and partly editorial throughput

Chapter 20 · 105 minutes

The Next Years, and a Conclusion

The lesson sorts the next years under the three labels: what is observable now, what is expected within five years and on what evidence, and what is speculation. It examines the form of the chapter's four projections, each with a label and a statement of what would show it wrong, retakes the test with a column for what would change each answer, and closes with the possibilist stance: a reasonable hope that demands work, and the list for Monday.

Learning objectives

  • Classify statements about the next years as observable, expected or speculation, with the evidence the chapter gives.
  • Write a projection in the chapter's form: claim, label, evidence and what would show it wrong.
  • Explain what would change each measured answer of the test, and why two answers cannot change.
  • Draft the Monday list for one organisation and commit to a date for the next rendering.

Key concepts

Wrong in a reviewable way
The practice of AI Governance, Chapter 22: state each trend, classify its evidence, assign a horizon and set a review date. The Commission's dashboard is the model: it leaves each year's superseded baseline beside the new one.
Expected, with whose evidence
Expected means strong evidence with uncertain timing or form within five years. The chapter follows each expected statement with its evidence and says whose expectation it is, such as the Commission's baseline reaching 54.28 per cent in 2030.
Speculation justifies reversibility
Speculation is plausible, consequential and not yet evidenced. The book's rule is that it justifies reversibility, not commitment, and that it is written down so that it can be wrong on the record.
The form of a projection
Each of the four projections in the chapter carries the claim, its label, the evidence and what would show it wrong, because a projection that cannot be shown wrong is a mood. The manuscript marks them as drafted for the author's confirmation.
A reasonable hope that demands work
The possibilist close: the picture is quieter than either story told about it and the designs that govern it exist, yet none of it happens by itself. The hope rests on the quiet picture and the designs, not on the count of three incidents.

Teaching plan

15 minParticipants retake the fourteen questions from memory and write, beside each letter, the reason: a denominator, a vintage, an article or a base rate. The teacher shows the table with what would change each answer.
25 minLecture: the three sections Observable, Expected and Speculation, with the evidence behind each expected statement and whose expectation it is; then the form of the four projections and the one projection the chapter refuses to make.
15 minSorting: the teacher reads ten statements from the chapter without their labels; participants hold up one of three cards and defend the label with the chapter's evidence.
40 minExercise: participants write a labelled outlook for their own landscape and the Monday list.
10 minClosing: Figure 20.2 read in the thirty-second order one last time, and the seven questions every reader can ask of the same page.

Discussion

  1. Twelve of the fourteen answers are expected to change at the next survey, snapshot or instrument, and two are history. What does a test whose answers move teach about the landscape it measures?
  2. The chapter leaves out the projection most readers want, whether AI at work will be good or bad for the people in it. Why do the data and the stance not permit it, and what does the chapter offer in its place?
  3. The comfort of three entries among 1,498 classified incidents is limited, because a tail event would not appear in the record until it had happened. On what does the chapter rest its hope instead?

Exercise · 40 minutes

A labelled outlook and a Monday list

For your own organisation's landscape, or for Nordvik Region or Hansa Mutual at the end of 2027, write an outlook of six statements about the next two years: two observable, two expected and two speculation. Give the evidence for each expected statement and say whose expectation it is. Turn one statement into a projection in the chapter's form: the claim, its label, the evidence and what would show it wrong, with a review date. Then write your Monday list from the chapter: count the units including the ones nobody chose, place each on the grid, look at the empty corner, name a holder for every mark without a seat, ask when each control behind a dashed baseline at R3 was last tested, ask the suppliers what they have switched on, and set the date of the next rendering.

Deliverable: Six labelled statements with evidence, one projection with a falsifier and a review date, and a dated Monday list with a named person against each line.

Self-test

  1. Which of these statements does the chapter place under Expected, and on what evidence?

    1. That a public authority in the EU lets an agent act at Level 3 Bounded on a resident's case within five years, because vendors forecast it
    2. That the next Eurostat enterprise survey reports a higher share than 19.95 per cent, because the share has risen at every survey since 2021
    3. That the next amendment of the AI Act defers the Annex III date again, because a date that has moved once can move
    4. That a system escapes control and causes catastrophic harm, because the incident database holds three entries
  2. In the table of the test retaken, why can the answers to Questions 3 and 9 not change?

    1. Because Eurostat has stopped running the AI module, so no later value will replace the two answers
    2. Because both rest on vendor surveys that will not be repeated
    3. Because both are fixed by Regulation (EU) 2026/1744
    4. Because they are history: two published past values, and a 2023 baseline that is a document
  3. What do the chapter's projections have in common in their form?

    1. Each carries a label, its evidence and a statement of what would show it wrong
    2. Each is labelled observable, because it rests on adopted legislation
    3. Each gives a single number for 2030 without a range
    4. Each concerns Nordvik Region and Hansa Mutual only

Answers to the self-tests

Chapter 11A · 2C · 3D
(1) Eurostat gives 19.95 per cent for all enterprises with ten or more employees in 2025. The figure 55.03 per cent is for large enterprises, 30.36 for medium-sized ones, and 8.06 was the share in 2023. (2) The largest domain is Malicious actors and misuse with 566 incidents, 412 of them fraud, scams and targeted manipulation. The subdomain closest to a runaway system has three. The counts measure what was reported and accepted, not all harm. (3) Self-selected surveys come third. They are large and informative but representative only of the people who chose to answer, so the book quotes them as perception data about their respondents, not as a share of a population.
Chapter 21B · 2C · 3A
(1) The volumes share six colour classes defined by rank, and none of the 284 diagrams carries a legend. In consequence the same grey means the ambient usage mode in one volume and production systems in another. (2) The binary puts one line where the landscape has four and puts it between Level 0 and everything else. The line that matters most runs between Level 2 and Level 3, above which a class of actions happens without anyone approving each one. (3) The headline for paid cloud services in 2025 is 52.74 per cent. On the Digital Decade definition, measured on intermediate and sophisticated services only, the share is 46.69 per cent.
Chapter 31D · 2B · 3A
(1) The rule is not a sentence in the agent's instructions. A policy decision point outside the agent checks every action against a written list and refuses anything not on it. A rule enforced outside the agent limits what happens when a rule is broken. (2) The defining property is identity. The assistant acted with the caseworker's login and permissions, saw only what the caseworker could see, and the trail leads to a person who chose to send. (3) Until the first drill the requirement was a sentence everyone had agreed to and nobody had tested. The chapter says the clause was not false; it was a promise. A log showing the stop arriving and the system halting would be evidence.
Chapter 41C · 2B · 3D
(1) The mark is drawn at the highest level held for any action that changes something outside the unit. Read-only actions do not set the column, because autonomy over a read changes nothing that would need undoing. (2) The drawing rule follows AI Red Team, Chapter 6: a Level 3 capability without a policy point outside the model is Level 4 with a misleading label, so the mark is drawn with a thin red outline. (3) Reach is an absolute count of people touched in a year, not a share of the organisation and not transactions: S under 100, M 100 to 999, L 1,000 to 9,999 and XL 10,000 and more.
Chapter 51C · 2A · 3B
(1) Eurostat publishes both shares as shares of all enterprises: 19.95 per cent used at least one technology and 8.28 per cent at least three. Dividing one by the other gives about 41.5 per cent, which the author calls his estimate. (2) Eleven units are drawn in five usage modes. The model holds thirteen entries; the SOC triage assistant and the exposure prioritisation are planned and are not drawn before they start. (3) The thing in the rectangle is thirteen entries, among them a high-risk ranking system, a public assistant and vendor features nobody chose. One vote would pause some, could not pause others, and would not touch the features the vendors run.
Chapter 61D · 2B · 3A
(1) Wiping a host stops at Level 0 Advisory: the agent may propose it and a person does it, because a wiped host is hard to reverse. Enriching an alert runs to Level 4, and isolating a workstation and revoking a session to Level 3. (2) Rosters or shift hours allocated automatically were reported by 24 per cent of EU workers and work tasks by 21 per cent. After them the shares fall away, down to 5 per cent for pace and 4 per cent for allocation by customer ratings. (3) The sample is self-selected and unweighted, and the EU27 rows are a filter on it. The chapter says they are not a representative European figure.
Chapter 71C · 2A · 3D
(1) Article 25(1)(c) closes the loop: a deployer that changes the intended purpose so that the system becomes high-risk is considered its provider. The roles follow what a body does with a system, not which model is inside it. (2) A mark is placed with the supplier that operates it. HM-CONV sits in the second provider's container because that provider operates the service; HM-CA and HM-AWT are operated by the group and only run a line to the model chip. (3) The chapter lists three limits: counts reflect media attention and editorial throughput, the record is revised retroactively, and its one geographic field says little about Europe. The two figures for 2024 show the retroactive revision.
Chapter 81B · 2D · 3A
(1) The 2024 baseline was drawn after a second observation that stood only about 0.4 points above the 2021 value, where the first baseline had assumed about one point a year. The share rose, by 0.41 percentage points; it did not fall. (2) The year has two moves of one column each, one in each direction, one retirement and two additions. No unit changes row; nothing becomes harder to reverse. (3) The chapter calls Denmark's series the clearest warning against the ruler: the first two points point down and the last two point steeply up. It adds that some bends in country series are flagged breaks in the survey.
Chapter 91B · 2C · 3A
(1) Confidential data were disclosed through intrusion, phishing or intentional actions at 1.57 per cent of enterprises, against 1.15 per cent through employees' unintentional actions. For unavailable services and destroyed data, failure is the more frequent cause. (2) Fraud and discrimination by means of AI are patterns at scale; agents acting beyond their mandate are incidents in the wild; a system escaping control altogether has not left argument and laboratory demonstration, and the claim that it will is speculation. (3) The agents at Level 3 Bounded carry filled diamonds, seats and solid baselines and are the best-governed marks on the page. The marks needing a decision are the unseated Mode 0 square and the recruitment screening service whose proof at R3 is the supplier's attestation.
Chapter 101C · 2D · 3A
(1) Reach is a count of people, not of transactions. A unit that handles 400,000 transactions for 12,000 people is XL by people, and it would be XL at four million transactions. (2) The 2025 report states that it used the agency's updated methodology of August 2025, so the later count is no baseline for the earlier one. Two numbers are comparable only when the thing counted, the way of counting and the period are the same. (3) A denominator corrects the size instinct; it does not excuse a harm. The reversibility rows exist so that irreversible outcomes are seen by position and not lost in a rate.
Chapter 111D · 2B · 3A
(1) The amended Article 113 has the Annex III obligations apply from 2 December 2027, where the original text had 2 August 2026, and the Annex I ones from 2 August 2028. A date moved by a recorded decision, and the obligations wait at the new one. (2) The test found three missing pieces of the fallback. Its conditions were met on 30 June, and the deputy of each home-care unit then plans the routes by hand one week a month. Reversibility lives in the people, procedures and data outside the unit. (3) The instinct hides decisions by making the technology the subject of the sentence. The rewritten sentence names an act and a person who holds the decision right: it has a seat in it.
Chapter 121C · 2A · 3D
(1) The rostering system, the approved conversational assistant, the embedded workplace assistant pilot and the paused recruitment pilot rest on attestations alone, and all are operated by suppliers. The auditor asks what each supplier would have to show for the declaration to be checked. (2) A practice prohibited under Article 5 of the AI Act is not improved by a productivity reading, nor a unit in the empty corner by a compliance reading. And an organisation with nobody to read for security or compliance cannot fix that by asking one leader to read twice. (3) The vendor sells the tools the survey asks about, its 2025 telemetry excludes European Union tenants, and the percentages describe expectation and self-reported deployment. The leaders' chair is a chair of expectation.
Chapter 131B · 2C · 3D
(1) The second draft keeps every fact of the first and reaches a different finding: the alert reached an analyst without the decision or the mandate, and the record named an owner but not who decides the stop inside the budget. (2) The right had been designed; the gap was the means to exercise it at night. A break-glass credential for one action was given, and the October re-drill came in at 11 minutes. The seat stayed at T2. (3) An entry such as scammers gathers many actors under one name, where organisations are counted one by one. The sorting is the author's classification, and the figure shows how the record is labelled. No public dataset records whether a decision right was designed.
Chapter 141A · 2D · 3C
(1) Reversibility is assessed on the action the AI takes or shapes. A Level 0 Advisory unit does not act, but its row is set by the outcome its suggestion shapes: a benefit application pushed down a queue for a month takes weeks and a process to undo. (2) A level nobody set is, in effect, whatever the permissions permit. The worst defensible case is drawn and noted as such so that the mark is challenged rather than accepted. A unit is never left out because its fields are unknown. (3) The landscape records the stop path under evidence by whether it has been exercised. A stop run in a drill and logged is evidence and the baseline is solid; a stop that exists as a paragraph in the mandate is a declaration and the baseline is dashed.
Chapter 151B · 2D · 3A
(1) A trail is drawn for a change of column or row and for nothing else. Changes of seat, baseline, size, colour, shape or diamond are shown as they stand at the later date and are read against the earlier picture or in V4 and V5. (2) The date is in the adopted text of Regulation (EU) 2026/1744, so it is observable. The statements about the next survey, the pace and agents deciding benefit cases are each labelled speculation in the chapter. (3) Both tests pass with conditions: Nordvik Region's supplier shift-swap feature stays frozen and Hansa Mutual's test freezes any extension beyond Germany. A test that fails outright is what moves a mark up a row.
Chapter 161D · 2B · 3A
(1) The data region is a property of the service, which the vendor can change, not of the law, which it cannot. The view does not say the choice is wrong; it makes the placement visible as a choice with a legal character. (2) The subsidiaries use the group platform in Germany, so their people and data travel to the marks and the marks do not travel to them. A reader who counts containers will not find the jurisdiction, which is why the subtitle names the seven countries. (3) The figures come from Synergy Research Group's press releases, rest on a proprietary model with no published methodology and are restated between releases. The Commission relays them; the book calls them one vendor's estimate and not a measurement.
Chapter 171C · 2A · 3D
(1) The vendors set the level. The head of the group AI platform, as owner of the AI inventory, takes the right to say which supplier-enabled features the group relies on and writes notice clauses. The bar is unchanged and the row still has no diamond. (2) The Region has always had its own logs, gates and tests for the system. The schedule adds dated declarations from the supplier, such as the notice period before a model change. It is drawn hatched because that is what it is. A hatched cell beside filled cells is honest. (3) A name is necessary and not sufficient. The review asks the six questions before the seat is drawn; a no to any of them means the seat is not drawn yet, because a seat without the means tells the board the question is answered.
Chapter 181B · 2C · 3B
(1) The XL square stays at Level 3 and R3. After a stop drill that took 17 minutes against a budget of 5, the board takes the decision right over every agent with write access to production, and the seat changes from 2 to 4. (2) The Region's numbers move more because it has more hollow diamonds to fill. Hansa Mutual's are 16 and 16, 16 then 17, and 12 then 13 of 17. The strips are explained number by number and not added up into a score. (3) On 1 May the Region's agentic work tools move from Level 2 to Level 1, when the platform team's agents are brought under the ceiling the security architect's role charter sets. The rostering system's trail runs the other way, to Level 3.
Chapter 191C · 2A · 3D
(1) The two assistants sit at Level 1 Assisted and draft. The claims-triage agent sits at Level 3 Bounded for routing and allocating a claim and at Level 0 Advisory for settling one. Automated is five answers, not one. (2) The benefits-triage system sits at Level 0 Advisory: it ranks the queue by urgency and caseworkers decide every case. The Region runs no Mode 5 agent. The quiet harm is a ranking that deprioritises the wrong people, and the seat above the mark reads 2. (3) Two points, 313 and 463, do not make a trend. The counts are real, but earlier years keep rising as reports arrive, adoption rose in the same period, and there is no count of deployments to divide by.
Chapter 201B · 2D · 3A
(1) The rise at the next survey is expected, though its size is not evidenced and the chapter gives no figure. The other three are listed under Speculation: plausible, consequential and not yet evidenced. (2) Question 3 concerns the change between 2021 and 2023, and the past does not move without a revision of the published values. Question 9 concerns the baseline computed in 2023, which is a document. The other twelve are expected to change. (3) Each projection is labelled expected or speculation and says what would show it wrong, because a projection that cannot be shown wrong is a mood. They are confined to one marked section of this chapter.

Final assignment

A landscape pack for one organisation, with a labelled outlook. Produce a landscape pack for your own organisation, or, if you cannot use real material, for Nordvik Region or Hansa Mutual extended with a scenario of your own. The pack draws every AI use as one mark in Contour, from the records the organisation already keeps, and reads it in the standard views: the one-page landscape, change between two dates, supply and jurisdiction, decision rights and evidence. It lists the gaps as findings with an owner and a date, applies the nine rules of thumb to one real document about AI in the organisation, and ends with an outlook in which every statement about the future carries one of the three labels. Present it in fifteen minutes to a mixed audience that reads it from the productivity, security and compliance chairs.

Assessment criteria