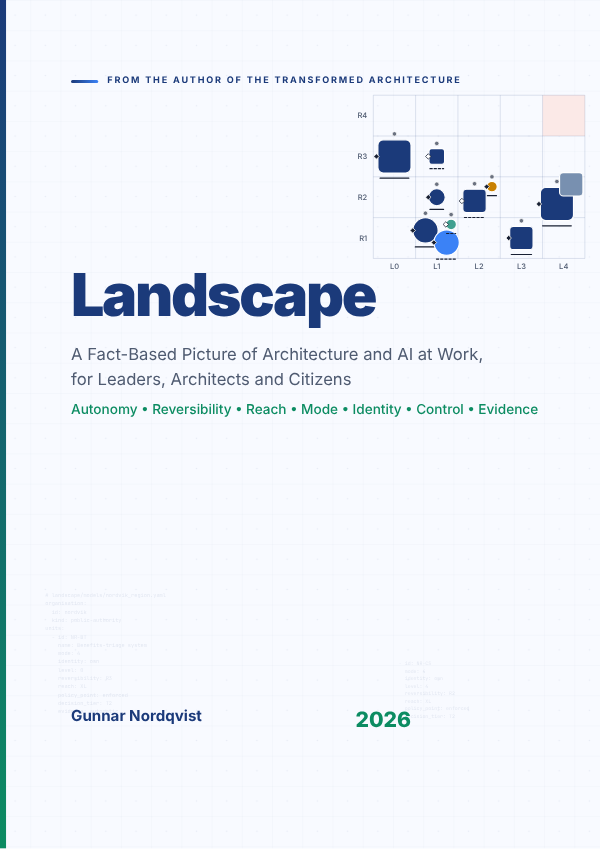
A fact-based picture of AI at work: a test, a notation and nine rules of thumb
For a mixed audience of leaders, architects, public officials, journalists and citizens, with no technical background assumed
The keynote follows the book's method: ask first, show the measured answer second, and only then talk about why the two differ. It puts questions from the test to the audience, shows that the measured picture is lower, flatter, quieter and later than the one most of us carry, and names the instincts that give wrong answers a direction. It then draws the alternative, a notation in which every AI use is one mark read the same way every time, on two fictional organisations, and ends with a stance that is neither optimist nor pessimist: the facts allow a reasonable hope and demand work.
8 min
A test for the room
Four questions put to the audience with three options each; answers are collected before the measured ones are shown.
In 2025, 19.95 per cent of EU enterprises with ten or more employees used at least one AI technology; 15.36 per cent of people aged 16 to 74 had used a generative AI tool for work in the previous three months.
The most frequent recorded harm in the AI Incident Database is people using AI to defraud, deceive or manipulate other people.
Wrong answers are not ignorance, which would be random; they have a direction.
7 min
Why the old pictures mislead
One box labelled AI, humans versus machines, and the cloud each hide a scale.
Eurostat counts eight technologies, used in 2025 by between 11.75 and 1.39 per cent of enterprises.
Rosling's remedy for two boxes was fixed scales drawn the same way every time; the same remedy applies here.
10 min
One mark, seven dimensions
Autonomy level, reversibility, reach, usage mode, identity, control and evidence: column, row, size, colour, shape, diamond and seat, baseline.
Nordvik Region's landscape read in thirty seconds: the empty corner first, the names last.
The grey square at Level 4 Autonomous with no seat: AI that nobody chose, on both fictional landscapes.
Every figure of the two organisations is illustrative and rendered from a model; none is data.
12 min
Nine instincts, nine questions
Which ones, and how many? At which level, for which action? Used for what, and deployed by whom?
What bent the last curve? What is the base rate and the quiet harm? Divided by what?
What was decided, by whom, and what would reverse it? What do the other two chairs see? Who held the seat?
Each rule has a limit: a rate does not make one irreversible outcome small.
8 min
A reasonable hope that demands work
Label every statement about the future observable, expected or speculation, and write projections so they can be shown wrong.
The picture is quieter than either story told about it, and the designs that govern agents exist.
Monday: count the units, place them on the grid, name the seats, test the promises, and render the picture again in a quarter.
What the audience takes away
Ask of any number about AI who produced it, over what population, and what the denominator is.
Ask of any AI use at which level it acts, how reversible its actions are, who holds the seat, and whether the evidence is automatic or a promise.
A landscape drawn the same way every time lets a board, an architect, an official and a citizen look at one page and ask the same questions.
Module 1 · Part I · The Test and the Picture · 45 minutes
A test, four old pictures and one new one
The lecture carries the argument of Part I. It starts where the book starts, with a test whose measured answers are lower, flatter, quieter and later than the picture most of us carry, and argues that the wrong answers have a direction because they come from instincts, not from ignorance. It then shows why the architecture diagram, the box labelled AI, humans versus machines and the cloud each hide what matters, defines the landscape from three scenes, and ends by reading Nordvik Region's one-page landscape aloud in Contour.
8 min
The test before the talk
Put three of the fourteen questions to the room and collect answers before showing the measured ones, as Chapter 1 asks.
Give the measured answers: 19.95 per cent of EU enterprises with ten or more employees used at least one AI technology in 2025, and the share rose by less than one percentage point between 2021 and 2023.
Random choice would give about 4.7 of the fourteen; systematic misreading has a direction, and the direction comes from instincts that serve us well elsewhere.
8 min
Four old pictures and what each hides
The architecture diagram shows how a system is built, and nothing about people, identity, decision or time.
The box labelled AI hides eight technology types, used in 2025 by between 11.75 and 1.39 per cent of enterprises.
Humans versus machines puts one line where the autonomy levels put four; the cloud hides ten services, a place and a law.
The author's survey of 284 diagrams of the seven volumes found 275 flowcharts and no legend: care in one picture does not give comparability across pictures.
9 min
The landscape, from three scenes
A quarantined email at Nordvik Region: software acted at the highest autonomy, with an identity of its own, and nobody decided.
A caseworker's draft: AI beside people acts with a person's identity and can do nothing that person could not do.
An overnight claim at Hansa Mutual: an agent acts with its own identity inside a limit that code outside it enforces.
Evidence is what a system produces; attestation is what a person or supplier declares.
12 min
Contour: one mark, seven dimensions
Column is the autonomy level, row the reversibility tier, size the reach, colour the usage mode, shape the identity.
A diamond is the policy point, a grey seat carries the decision tier, a baseline is solid for automatic evidence and dashed for attested.
Read the benefits-triage system NR-BT aloud, then the bare square NR-AMB: every missing control is drawn as an absence.
The top-right cell, Level 4 Autonomous at R4 Irreversible, is the empty corner and is shaded in every view.
8 min
Reading in a fixed order, and the stance
The six reading steps: the empty corner first, then squares at Level 3 and above, missing seats, dashed baselines at R3, colours, and names last.
The stance is possibilist: the data support neither the loudest hopes nor the loudest fears; they support work.
Every statement about the future carries the label observable, expected or speculation.
What the audience takes away
Ask first, show the measured answer second, and only then talk about why the two differ.
Everything the old pictures hid lies on a scale, so a picture with fixed scales and fixed meanings can show it.
A landscape is read in a fixed order: the empty corner first and the names last.
The lecture carries the argument of Part II: each instinct is a habit that serves well almost everywhere else and misleads on this landscape for a reason that can be shown in public data. It groups the nine by what they distort. The box, binary and model instincts hide what a unit is; the straight-line, fear and size instincts distort numbers and stories; the destiny, single-perspective and blame instincts hide decisions. For each group it shows one piece of evidence, one corrected view of Nordvik Region or Hansa Mutual, and the rules of thumb with their limits.
6 min
The form of every chapter
Each chapter gives the instinct a fair hearing first: a budget needs a line, the law draws binaries on purpose, fear is useful where the hazard is real.
Each states what its evidence does and does not show, and separates published figures from the author's own estimates and classifications.
Each corrects the picture with one view and ends in one rule with a stated limit.
16 min
What a unit is: box, binary, model
Box: Eurostat counts eight technologies and seven purposes; Nordvik Region's committee paper shows one rectangle where the register lists thirteen entries. Ask which ones, and count them before you judge them.
Binary: automated is five answers, not one. Hansa Mutual's SOC investigation agent holds three levels across four actions, and the line that matters runs between Level 2 Supervised and Level 3 Bounded.
Model: the incident record has no model column, and Annex III of the AI Act lists uses. Ask what it is used for and who deploys it before asking which model it is.
In the supply and sovereignty view the model is a chip at the edge; the one-page landscape names no model at all.
16 min
Numbers and stories: straight line, fear, size
Straight line: four baseline trajectories for the same series ended at 20.29, 16.76, 35.92 and 54.28 per cent in 2030. Ask what bent the last curve and what could bend this one.
Fear: outages by failure, 17.97 per cent of enterprises, outnumber outages by attack, 3.43 per cent. Find the base rate and the quiet harm the story hides.
Size: 10.45 million ICT specialists are 5.0 per cent of employment. Never accept a number alone; ask what it is divided by and compared with.
The limits matter: the base rate does not help with a mark in the empty corner, and a rate does not make one irreversible outcome small.
16 min
Decisions: destiny, single perspective, blame
Destiny: a date in the AI Act moved by sixteen months through a recorded decision. Ask what was decided, by whom, and what it would take to reverse it.
Single perspective: productivity reads colour and size, security shape and diamond, compliance row, seat and baseline. Read from the other two chairs before you decide.
Blame: the second draft of the post-mortem finds that nobody was named to decide the time to stop. Look for the seat before the culprit.
In the scenario both organisations start 2027 with one row at T0 and end it with none.
6 min
What the nine have in common
Each rule turns a statement into a question that a landscape, a register or a record can answer.
The evidence is about institutions and records; where no survey measures what people or boards perceive, the chapters say so.
Naming the instincts is half the method; the other half is a picture that resists them.
What the audience takes away
An instinct is a useful habit applied in the wrong place; each rule of thumb names where it stops applying.
Every corrected picture is the same landscape read for a different dimension: count, column, chip, trail, seat, size, row and baseline.
The marks that most often need a decision are the quiet ones: no seat, no diamond, a dashed baseline at R3 Hard to reverse.
Module 3 · Part III · Drawing Your Landscape · 50 minutes
Drawing your landscape: from records to six views
The lecture carries the argument of Part III: a landscape is a join of records that already exist, and the gaps in the join are the finding. It follows one unit, Nordvik Region's rostering system, through all the views: populated from the inventory and the delegation profile, moved one column in the time view with its controls in place first, placed with an EU application supplier, read in the decision-rights and evidence views, and compared with Hansa Mutual at the end of the scenario year. It closes on what the views show and what they refuse to say.
10 min
A join of records, and the gaps as the finding
The AI inventory, the mandate, the delegation register, the contracts and the proxy logs each answer different fields of the model.
Reversibility and reach are assessed, not copied: the action the unit takes or shapes, and people, never transactions.
Unknown fields are drawn as absences or as the worst defensible case with a note. The unit is never left out.
The list of absent seats, absent diamonds at Level 3 and above, dashed baselines at R3 and not decided is the deliverable, not the figure.
10 min
A year: trails, and what trails leave out
A trail is drawn for a change of column or row and for nothing else.
Drift shows as a trail whose end lacks a filled diamond, a seat or a solid baseline; decay as a row that should have moved up and did not.
The rostering system's policy point is enforced on 20 January and its level rises on 11 March: control before autonomy.
Hansa Mutual's year has no trail and four changes of control, so V2 is read together with V4 and V5 at both dates.
10 min
Where it runs and under whose law
Four roles: model provider, hosting, application and operations. Suppliers are containers labelled by role and jurisdiction, never by brand.
Solid for the organisation's own boundary, dashed for a supplier, dotted for a jurisdiction outside the EU and the EEA; an EU region of a non-EU vendor is drawn dotted.
The mark always belongs to the organisation: it is the deployer of every mark on its landscape, as the chapter reads the AI Act.
The supply side of the market is not officially measured; V3 is the measurement an organisation can make for itself.
12 min
Who decides, and how we know
V4: a bar to the ceiling, thin bars per action class, a diamond where a policy point enforces, a seat with the holder's tier.
Three conclusions become drawing rules: a name is necessary and not sufficient; Level 3 without a policy point is Level 4 with a misleading label; attestation is not evidence.
V5: filled cells for what the system produces, hatched for what a person or supplier declares, a red none where there is neither.
The stop path has no symbol; it appears as a drill result, a number nobody can declare.
8 min
Two landscapes compared, and no ranking
The comparison frame draws both at identical scales with one legend and forbids rescaling.
The Region's year is motion and the group's is seats; the summary strips count diamonds, seats and baselines and are not added up.
The frame shows who holds the seats and where the proof comes from, and withholds a verdict on who is ahead.
What the audience takes away
Start from the records you already keep, draw every unit, and treat each gap as a finding with an owner and a date.
Read a year in V2 for movement and in V4 and V5 for control; the changes that matter most often leave no trail.
A seat is real when its holder can produce a recent measured time for a stop, from a drill and not from a design.
Seeing clearly: nine questions, three labels and Monday
The lecture carries the argument of Part IV. The rules of thumb do not replace the landscape; they are what to ask of it, and of any document that describes it without drawing it. The lecture takes one board paper apart with the rules, shows how each of five readers starts from the word that triggers an instinct, then sorts the next years under three labels and shows the form of a projection that can be wrong on the record. It closes with the possibilist stance: the facts allow a reasonable hope and demand work.
10 min
One board paper, nine questions
The AI is now automated across claims handling becomes seventeen units, three of which touch claims handling at scale, at stated levels.
Our model becomes a use reclassified under Annex III point 4(b) while the model does not change.
A dashed line to 2030 on two measured years is labelled speculation; the Commission's four baselines are the public example of a line redrawn every year.
The rewritten paragraph is longer and is the first version a board could act on.
8 min
Five readers, one checklist
The architect makes a rise to Level 3 Bounded conditional on a filled diamond, a solid baseline and a tested fallback.
The public official answers rogue AI with a base rate of 3 in 1,498 and points to the quiet harm in the R3 row.
The journalist names the gap: the count rose, and whether the rate did, nobody can say.
The citizen asks the seat's question at work: who decides, and who can be asked to decide otherwise.
12 min
The next years under three labels
Observable: adoption at 19.95 per cent of enterprises in 2025, recorded harms that are quiet, and the AI Act's dates as amended in 2026.
Expected, each with its evidence: a recomputed Commission trajectory, a higher share at the next survey, agents arriving at buyers as features, seats on high-risk marks.
Speculation, kept short and written down: an agent at Level 3 on a resident's case, a further deferral, a system escaping control.
A projection carries its label and what would show it wrong; the chapter's own are marked in the manuscript for the author's confirmation.
10 min
A reasonable hope, and Monday
The picture is quieter than either story told about it, and the designs that govern agents exist: a policy point, a named person, evidence the system produces.
None of it happens by itself: the grey square without a seat, the dashed baseline, the missing denominator.
Monday: count the units, place them, look at the empty corner, name the seats, test the promises, ask the suppliers, label next year, and render again in a quarter.
What the audience takes away
The nine rules are questions a meeting can put to any document about AI before it decides on it.
Label every sentence about next year, and write projections so that they can be wrong on the record.
The facts allow a reasonable hope and demand work; the picture is the instrument for both.